


Abstract
Climate change is projected to increase both the intensity and proportion of major hurricanes in the North Atlantic, posing significant challenges for insurers and reinsurers in evaluating this evolving risk. Traditional approaches to adjusting catastrophe models typically involve resampling events to increase the frequency of high-category hurricanes. However, in some operational settings, resampling may be undesirable or infeasible because the number of events in an event set must remain fixed. This paper presents a frequency-aware quantile mapping (FAQM) approach to shift the probability distribution of hurricane wind speeds under such constraints.
This method transforms the severity distribution of landfalling wind speeds from a baseline view toward a climate-conditioned target, while preserving the original event structure. Changes in the frequency of the more intense events are approximated indirectly through redistribution of severity within the fixed event set, prioritising more intense events by smoothly transforming the wind speed of each event.
Using a controlled experimental setup, we illustrate how the method modifies wind speed distributions, and examine the resulting impacts on insured loss metrics under simplified loss assumptions. The results demonstrate that FAQM can reproduce target severity distributions effectively and provide a pragmatic alternative for exploring climate-conditioned loss sensitivity when the number of events in the underlying event set cannot be altered.
Key Points
- Frequency-aware quantile mapping (FAQM) adjusts hurricane wind speed distributions to a climate-conditioned target while preserving the event set count and structure.
- Under idealised loss assumptions, FAQM closely reproduces the target climate-conditioned loss exceedence curves.
- The choice of adjustment method materially shapes the resulting view of risk and should be treated as an explicit modelling assumption by (re)-insurers.
1. Introduction
Climate change is projected to increase both the intensity and proportion of major hurricanes (IPCC, 2023; Knutson et al., 2020) posing new challenges for (re)-insurers assessing future risk. Commercial catastrophe models are typically calibrated to historical data and represent some form of smoothed climatological view. Although many commercial catastrophe models also provide present-day or climate-conditioned views of risk, the view of risk of an individual insurer or reinsurer may not be reflected by their vendor model. They may want to adjust these views to reflect alternative, or in-house views of risk. These alternative views may incorporate shorter-term persistence assumptions (e.g., previous 5–10 years), forward-looking climate projections, or specific stress-tests. Consequently, modifying the frequency-intensity distribution of hurricanes in the catastrophe model event set has become a critical technique in the insurance industry for tailoring catastrophe models to reflect alternative views of risk.
While there is little scientific consensus on how climate change alters the full intensity distribution of hurricanes there is a general consensus that there will be a greater proportion of the most damaging category 4 and 5 hurricanes (e.g. IPCC, 2023). Sensitivity analyses consistently show that increases in the frequency of the most intense hurricanes are the primary driver of projected growth in insured losses, even when total storm counts remain unchanged (Jewson, 2023b). Since this is the most scientifically robust component of the literature it is natural that (re)-insurers focus on this impact. Industry practitioners have recently been drawing on the climate science syntheses of Knutson et al. (2020) as a quantitative basis for sensitivity studies to understand the financial impacts of changes in the frequency-intensity distribution of hurricanes.
From this quantitative data, a common approach for constructing alternative climate views is category-based resampling. In this approach the frequency of hurricanes in different Saffir–Simpson categories are adjusted to reflect published climate signals (e.g.Jewson, et al., 2020; Jewson, 2023a). Category-based resampling offers a scientifically defensible way to implement published climate signals within existing catastrophe modelling frameworks. It is flexible, scalable, transparent, and easy to communicate to stakeholders. However, it relies on coarse Saffir–Simpson categories, which may not be the most physically meaningful for loss estimation and may miss nuanced shifts in the intensity distribution. Most of the scientific literature reports basin-wide changes in the frequency-intensity distribution of tropical cyclones. To construct an alternative view the basin-wide frequency information must first be converted into landfalling frequency changes by category over specific segments of coastline; this is a critical step and inherently non-trivial (Jewson, 2023a). Moreover, changes in hurricane intensity at landfall may not reflect changes in basin-wide intensity trends, further complicating the translation of published scientific findings into model adjustments. Despite these limitations, category-based resampling from peer-reviewed publication data remains a standard tool for constructing climate-conditioned hurricane loss scenarios in the insurance industry. Category-based resampling underpins a range of vendor analyses (e.g. Verisk, 2020) as well as recent peer-reviewed studies (e.g. Jewson, 2023b; Pope and Phibbs, 2025).
Alternative approaches that do not use category-based resampling are typically physics-based. For example, Fosu et al. (2024) use dynamical downscaling of CMIP6 climate model data with the Columbia Hazard model for Assessing the Hazard of Cyclones (CHAZ; Emanuel et al., 2006, Lee et al., 2018) framework to generate future hurricane distributions. Knutson et al. (2022) simulate hurricanes directly in climate-conditioned environments in a dynamic model. These methods can capture more nuanced changes across the full frequency-intensity distribution, but they are complex and not yet easily digestible into the catastrophe modelling framework.
In recent years, newly developed open-source and commercial stochastic event sets tailored to developing alternative climate views have become increasingly available. The Columbia Hazard model for Assessing the Hazard of Cyclones (CHAZ; Emanuel et al., 2006, Lee et al., 2018) and the Synthetic Tropical cyclone generation Model (STORM; Bloemendaal et al., 2020) are two publicly available models that provide synthetic storm track data, while Reask (Loridan and Bruneau, 2025) and The Imperial College Storm Model (IRIS) (Sparks and Toumi, 2024) provide commercial solutions. These datasets offer detailed information on hurricanes at landfall, including location, Saffir-Simpson category, and wind speed. Although these datasets provide granular information, their validity in representing hurricane activity under climate change remains largely untested, and there is limited scientific consensus on regional changes in landfall risk. Nevertheless, they offer alternative climate-conditioned views that can be explored alongside traditional catastrophe models, and, given the nonlinear relationship between wind speed and damage (Southern, 1979), it is timely to investigate how these datasets can be leveraged to adjust vendor models.
The most obvious application of this data is to extend category-based resampling to adopt a more granular resampling approach, for example using narrower wind speed bins. While such an approach would address the limitations of Saffir-Simpson category-based resampling, all resampling approaches share fundamental constraints. Resampling approaches cannot produce hazard intensities outside those present in the underlying event set, they introduce stochastic sampling variability, and may disrupt spatial, temporal, or structural dependencies embedded in vendor catastrophe model event sets.
In this paper, we consider a more constrained setting in which, for operational reasons and to preserve inherent model characteristics, the total number of events in the event set must remain fixed. Under such constraints, a climate-conditioned view that increases the proportion of the most damaging storms cannot easily be implemented using resampling. To address this, we propose a frequency-aware quantile mapping (FAQM) approach that adjusts the distribution of landfalling hurricane wind speeds to reflect a climate-conditioned view of risk. Its scope is currently limited to tropical cyclone risk models.
2. Methodology
2.1 Data
The Imperial College Storm Model (IRIS) (Sparks and Toumi, 2024) provides an innovative and extensive stochastic event set of landfalling hurricanes across the U.S. Event sets under different climate conditions are made available to an insurance funded consortium to explore the potential impacts of climate change on hurricane landfall frequency. The IRIS framework necessarily relies on several simplifying assumptions. For example, storm simulations are initialised at the point of lifetime maximum intensity (LMI), focusing on simulating the storm decay. This is computationally efficient and helps minimise biases in the present-day climate, but may constrain the ability to represent climate-change-driven shifts associated with cyclone genesis and intensification processes. In addition, the model imposes zonal symmetry on the underlying environmental fields, which can limit its ability to capture regional asymmetries in storm-climate interactions. While IRIS may not fully capture all mechanisms through which climate change affects tropical cyclones, in particular those related to genesis and intensification or the spatial distribution of landfalls, it provides detailed statistical information on landfall characteristics that remains challenging to obtain from global climate models. This makes IRIS a pragmatic tool for exploring certain aspects of hurricane risk, including landfalling wind speed probability distributions under future climate conditions.
In this paper, we use proprietary data from the IRIS consortium, with their permission, to illustrate the proposed methodology. This dataset was chosen to serve as an illustrative example; other open-source or commercial alternatives such as CHAZ, STORM or Reask could also have been used. The choice does not affect the generality of the methodology. Two versions of this data are required to derive a baseline view (input) and an alternative climate-conditioned view (target) of wind speed probability distributions. In this paper, the IRIS 20-year view, constructed from ERA5 reanalysis data over the past two decades (2004-2023) is used as a baseline view. The climate target is the IRIS +2°C view, generated with an approach that scales observed potential intensity (PI) trends to a +2°C warming level, representing thermodynamic changes consistent with climate model expectations. In IRIS, lifetime maximum intensity (LMI) is derived by sampling from the observed distribution of LMI/PI, so increases in PI directly shift the LMI distribution upward (Sparks and Toumi, 2025). The landfalling rates along the entire U.S. East Coast for the IRIS 20-year baseline and the +2°C view are shown in Figure 1(a), and the percentage differences by Saffir-Simpson category are shown in Figure 1(b). These results are utilised in Section 3.
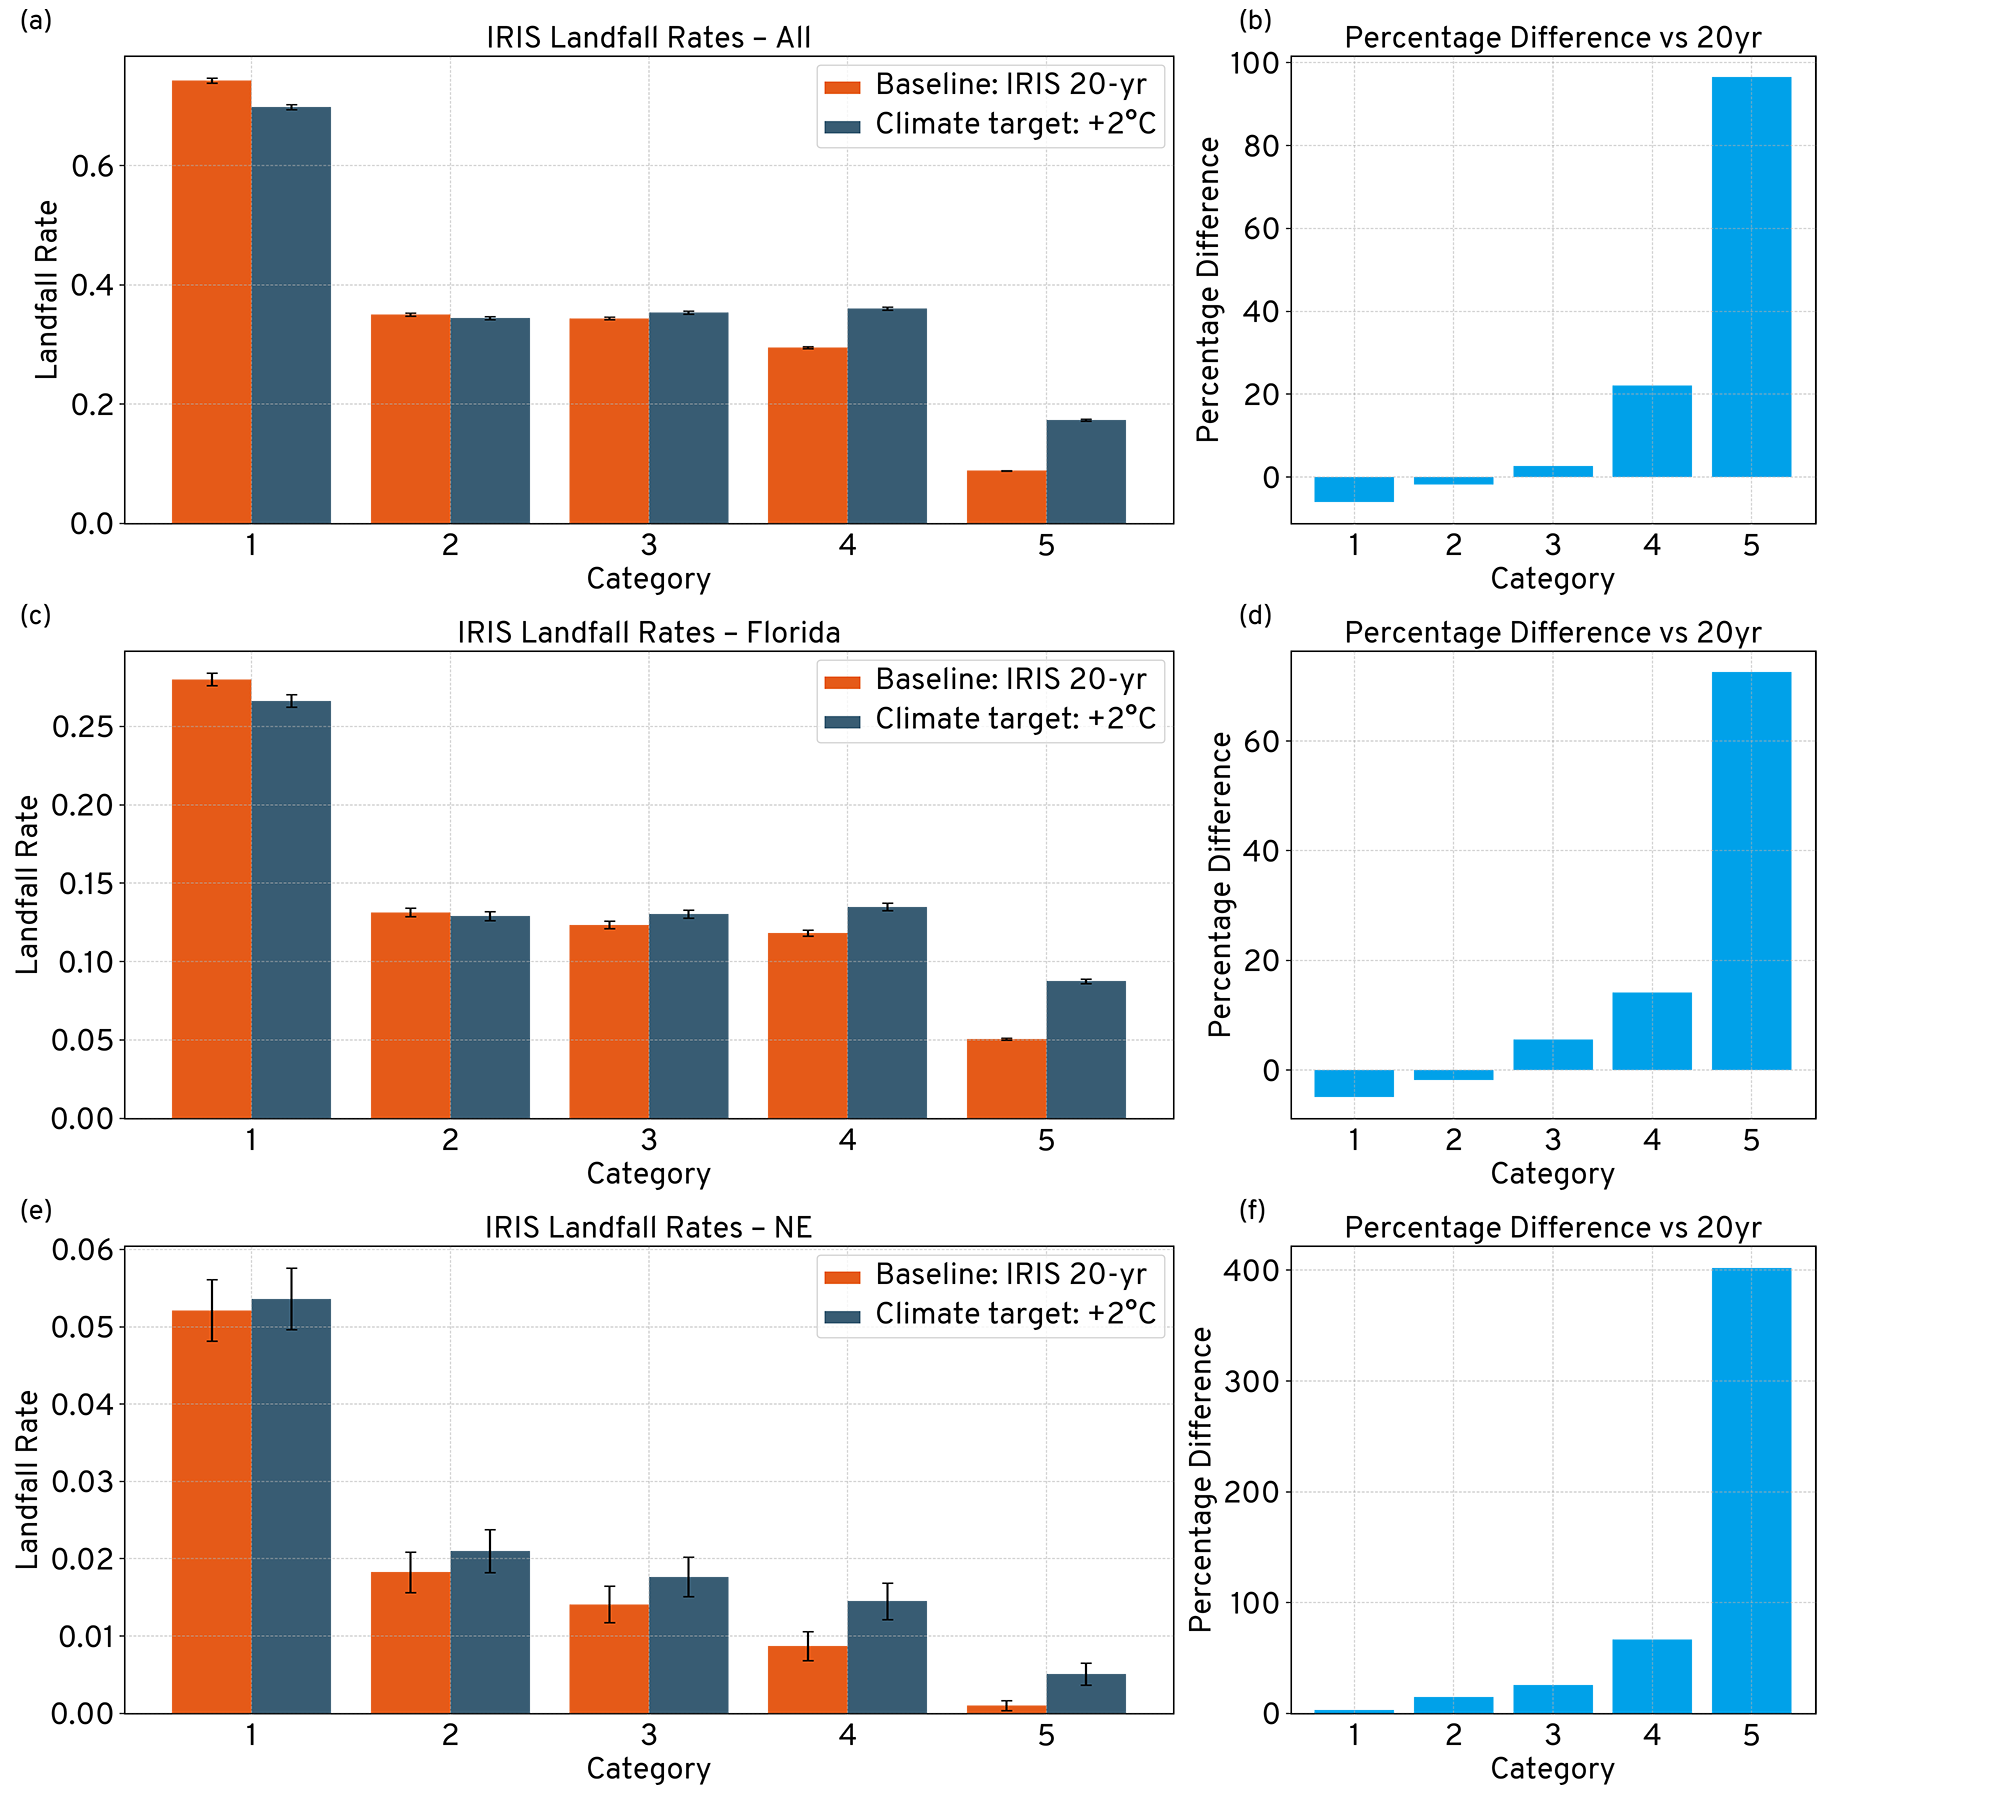
Figure 1: Changes in landfall rates of hurricanes by Saffir–Simpson category under a Plus 2°C climate scenario compared to the IRIS 20-year baseline view. Panels (a), (c), and (e) show absolute landfall rates for the entire U.S. coastline, Florida, and the North-East, respectively, with dark blue bars representing the 20-year baseline and orange bars the +2°C scenario. Panels (b), (d), and (f) show the corresponding percentage differences by category.
2.2 Category-based resampling as a benchmark adjustment
The FAQM approach proposed in this paper has been benchmarked against the category-based resampling method as it is widely adopted in the insurance industry. Category-based resampling, specific to hurricane models, consists in dividing the events in a stochastic model into groups, based on the event category according to the Saffir-Simpson scale. In presence of a target event frequency by category, the stochastic set is then adjusted by randomly sampling and duplicating or removing events in each category to match said targets. A simple example of a category-based resampling view is one where the proportion of category 4 and 5 hurricanes is increased and the frequency of category 1-3 hurricanes may remain unchanged; in this example the total frequency would have increased.
2.3 Frequency Aware Quantile Mapping
The aim of this methodology is to transform a baseline wind speed probability distribution into one that reflects an alternative climate-conditioned view using quantile mapping, i.e. approximating the effects of a frequency adjustment through a severity adjustment while keeping the total number of events fixed. To do this, we need the wind speed probability distributions for both the baseline and alternative views. In the example in this paper, we seek to map wind speeds from a 20-year historical baseline distribution to wind speeds from a distribution representative of a 2°C warmer world.
A direct quantile mapping of wind speeds between the baseline and climate-conditioned wind speed probability distributions accounts for changes in severity. However, the baseline and climate-conditioned datasets may differ in their total number of events and therefore landfalling rates. The most straightforward approach to account for a change in total frequency would be to resample the baseline datasets to match the sample size of the climate-conditioned one and subsequently apply a quantile mapping to adjust for severity. However, the aim of the methodology presented in this paper is to avoid altering the number of events in the event set. Instead, we adopt an approach that focuses on matching the upper tail of the target wind speed distribution, as this region exerts the greatest influence on the resulting loss statistics. This results in a frequency-aware quantile mapping (FAQM) where information on the relative frequency change is accounted for implicitly through severity adjustments. Matching the upper tail of the distribution inevitably comes at the cost of the lower part of the distribution being less well matched. The method incrementally increases the wind speeds of all events such that e.g. weaker category 1 storms become stronger category 1 storms, and the stronger category 1 storms become category 2 storms and so on. This implies that at the very bottom of the wind speed distribution some of the weakest storms have been eliminated from the event set. In this context where weaker category 1 events are highly unlikely to cause any significant insured losses it is not considered a significant issue. If a large shift in the distribution was required owing to a larger change in overall frequency this impact would be amplified. In this application, information allowing the method to be extended to tropical storms, expanding the lower end of the distribution, could mitigate this impact.
Given the probability distribution functions (PDF) for the input and target datasets `F_"in"` and `F_"trg"` and the corresponding cumulative distribution functions (CDF) `F_"in"` and `F_"trg"` we can begin to construct the FAQM.
The frequency-aware component of the FAQM is introduced by explicitly accounting for differences in total landfalling rates between the input and target datasets, while keeping the event count of the adjusted event set fixed. Since the event set has a fixed number of years, a change in the total number of events implies that there has been a change in the landfalling rate. A total landfalling rate change ratio is defined, which is independent of wind speed. Let the landfalling rates for the input and target datasets be rates `lambda_"in"` and `lambda_"trg"` respectively, then the landfalling rate ratio is then given by:
This ratio captures the relative change in overall landfalling rate (frequency) between the two datasets. Rather than modifying the number of events, this information is used to truncate and re-normalise the cumulative distribution function (CDF) in severity space. The target CDF is constructed such that if `r>1` i.e. the target has a higher frequency (more samples) we keep only the upper tail of the target distribution with mass 1`/r` and we normalise what is left. Let,
where `u^**` is a cumulative probability cutoff used to determine how much of the target distribution to keep, and `c` is a wind speed cutoff evaluated from the inverse CDF.
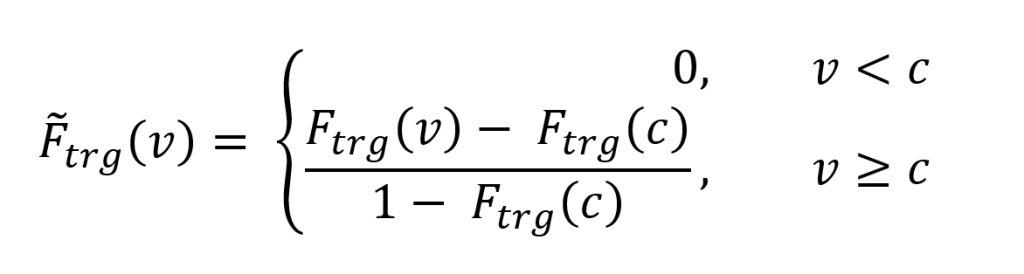
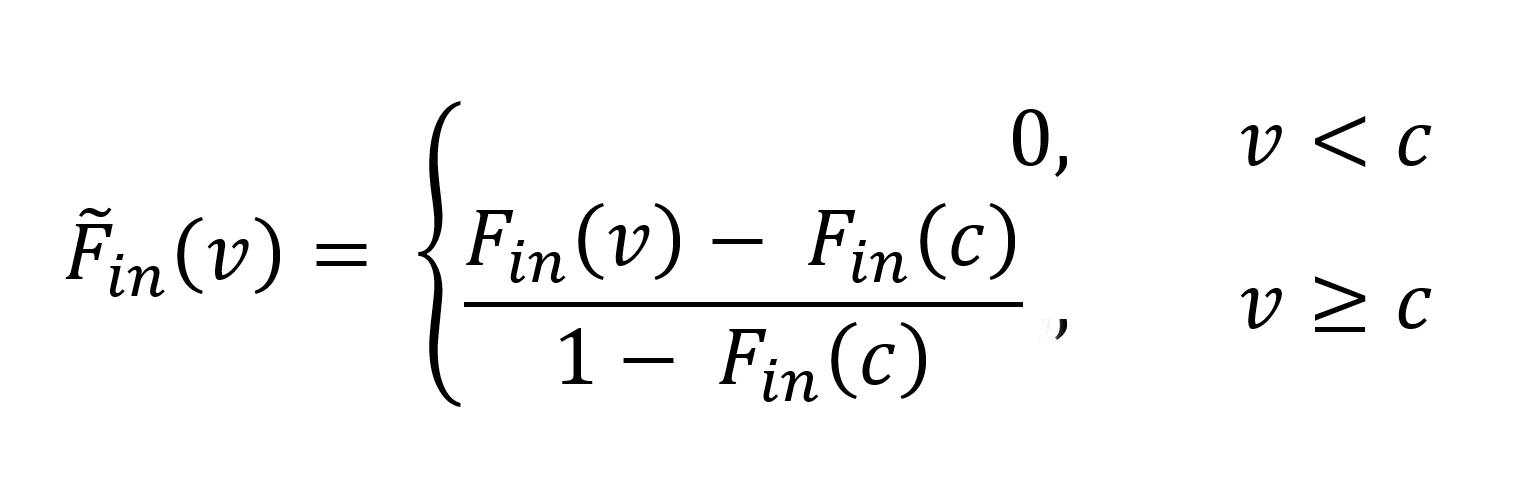
If `r<1`, i.e. the target has a lower frequency (fewer samples), we will perform a similar operation on the input distribution to keep the upper tail of the distribution with mass `r`. Then, `u^**` and `c` are given by
Where the modified input distribution is given by
The truncation and re-normalisation constitute the frequency-aware component of the FAQM; it approximates the impact of frequency changes by modifying the severity distribution while by construction leaving the total number of events unchanged. Provided the total landfalling frequency change is small any error is likely to be small.
From here we can follow a standard quantile mapping approach such that a wind speed in the input distribution can be mapped to its cumulative probability `p = F_"in"(v)`, where `p in [0,1]`. The probability is then mapped to a wind speed in the target distribution from `V_"trg" = tildeF _"trg"^-1(q)`. By combining these we can define a mapping function `H(v)` that maps wind speeds from the input data into probability space and back to the target distribution via the inverse CDF of the target distribution:
Finally, the mapping function `H(v)` is applied to each event’s landfalling wind speed in the input dataset to derive an adjusted wind speed for each event:
where `V_"adj"` is the mapped wind speed from the target distribution.
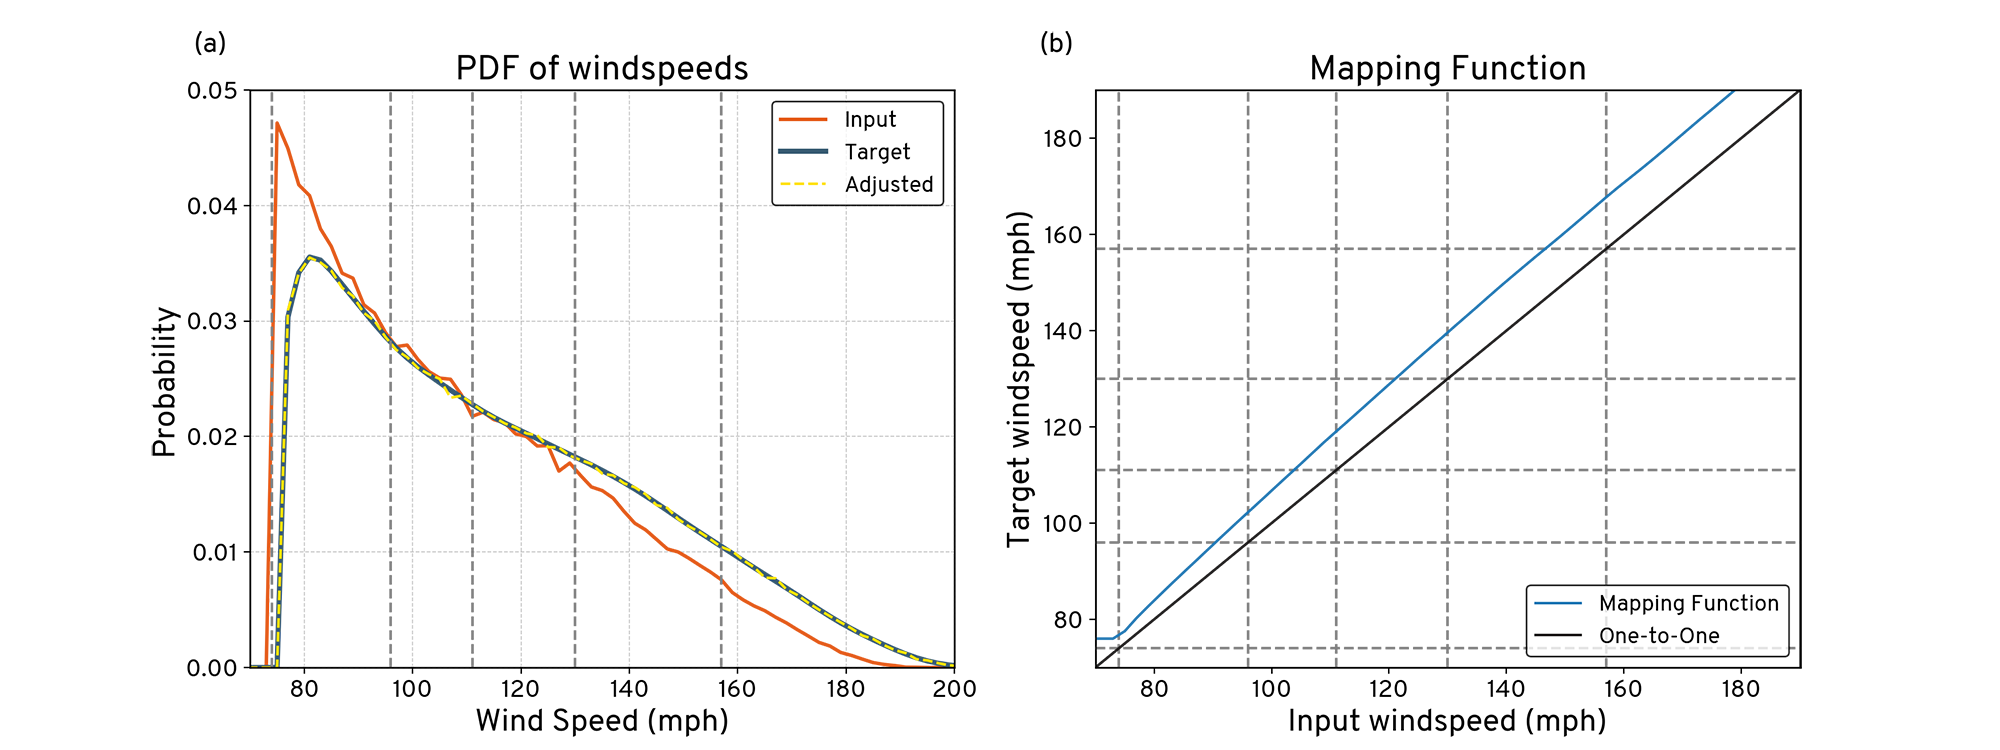
Figure 2: Panel (a) shows PDFs of wind speeds for the input (orange), target (grey), and adjusted distributions after quantile mapping (yellow). Panel (b) shows the mapping function `H(v)`, which maps input wind speeds to target wind speeds, shown in blue and the black line represents the one-to-one reference line.
The results of applying this frequency-aware quantile mapping methodology to derive an adjusted event-based conditional wind speed probability distribution are shown in Figure 2. Figure 2(a) shows the input, target and adjusted wind speed PDFs. The input distribution is shown in orange, the target in grey, and the adjusted distribution (after applying the quantile mapping) is in yellow. Figure 2(a) shows that the probability of having wind speeds above 125mph increases in the 2°C world, which is equivalent to saying that climate change will result in an increase in the proportion of major hurricanes. It can also be seen that the adjusted distribution closely aligns with the target, demonstrating the effectiveness of this frequency-aware quantile mapping in shifting the input towards the climate-conditioned view.
Figure 2(b) shows the mapping function `H(v)` and the dashed grey lines indicate the Saffir-Simpson scale thresholds. Although only a small proportion of events cross the category boundaries all events experience a small uplift in wind speed.
The FAQM treats the landfall intensity PDF as the primary quantity to preserve when adjusting the baseline view. This aligns well with the published literature that more intense hurricanes are expected in a warmer climate. However, the FAQM method also suffers from the following limitations: i) relying only on events that are already in the stochastic set it cannot change the actual event frequency, only mimic the impact of changing frequency through a severity adjustment; this makes it particularly suited for small changes in overall frequency; ii) FAQM underestimates the frequency of weak events to achieve a better performance on events that exceed the chosen hazard threshold – the authors consider this a reasonable compromise for reinsurance use cases; iii) like other statistical adjustment methods, FAQM does not take into account other physical characteristics of the events other than landfalling wind speed (e.g. it does not account for changes in the storm size, wind field, induced precipitation or surge).
The number of stochastic events in the IRIS dataset with wind speeds exceeding 180mph is limited compared with events of lower intensity and these events may have disproportionately large impacts on loss calculations. We therefore restrict the wind speed adjustment to events with landfalling wind speeds of less than 180mph where the synthetic dataset provides more robust statistical sampling. To ensure a fair comparison between the resampling approach and the frequency-aware quantile mapping, only category 1 and above events are adjusted.
2.4 Loss estimation
As the objective of this work is to understand the impact on insured losses of changes in the frequency-severity distribution of landfalling hurricanes, we require loss estimates by event so that we can construct year, event, loss tables (YELT) as typically done in catastrophe models for the insurance industry (Zanardo and Salinas, 2022).
In this experiment we construct synthetic event losses using a single loss function that can be thought of as a single vulnerability function as it translates a given wind speed into a loss using a power law, e.g. Nordhaus 2006, 2010, or Pielke 2007. Losses scale by
where `v` is wind speed and the exponent `beta` is the parameter to scale the wind speed into loss estimates; here we assume the exponent `beta=6`, as a representative average for insured losses from hurricanes. Since in this work the aim is not to realistically simulate losses but to assess an adjustment methodology, this choice is somewhat arbitrary and does not impact the results.
A single power-law relationship between wind speed and loss is applied uniformly across all events and across both baseline and climate-conditioned datasets. This setup allows the behaviour of the adjustment methodologies to be examined in a controlled setting where the “true” climate-conditioned losses are known.
This choice removes one of the principal practical challenges in applying the FAQM, namely determining how changes in wind speed translate into changes in losses within a realistic catastrophe model. In operational models, losses depend on a wide range of factors beyond local wind speed, including storm size, track, spatial footprint, exposure distribution, vulnerability functions, and secondary uncertainty. Resampling approaches inherit these relationships directly from the underlying model, whereas severity-based adjustment methods require explicit assumptions about how hazard changes translate into loss changes. The analysis presented in this paper should be interpreted as an evaluation of the hazard-adjustment component of the methodology under idealised loss assumptions.
Using this single transfer function which converts wind speed into loss we construct two separate YELTs. Firstly, for the 20-year baseline data from IRIS we construct a baseline YELT and then using the IRIS +2°C data we construct a climate-conditioned YELT. In this idealised setup we know both our baseline and climate-conditioned YELTs. This allows us to apply both the benchmark category-based resampling and FAQM approaches and compare their outputs against the known climate-conditioned result.
In the FAQM process we have defined a function `H(v)` (Eq. 3) to produce adjusted wind speeds; the final step is to derive a corresponding change in loss. To do this we use the loss function defined in Eq. (5). We define the loss adjustment factor as the ratio of the loss computed using the adjusted wind speed to the loss computed using the input wind speed:
In the FAQM the adjusted wind speed for each event in the YELT is calculated using the mapping function (Eq. 3). Then using this adjusted wind speed the loss adjustment factor (Eq. 6) can be determined. The original event loss is then multiplied by the loss adjustment factor to derive an adjusted loss for each event. Combining all events produces a YELT with adjusted losses whose distribution reflecting both the modified proportional frequency and severity of landfalling hurricanes under the alternative climate-conditioned scenario. By contrast, in category-based resampling, no additional step is required to adjust the losses as the addition/removal of events will by definition scale the losses up or down.
In this idealised experiment, a single loss function (Eq. 5) is used to estimate losses for both the baseline and climate-conditioned YELTs, and, to ensure internal consistency, the same function is applied within the FAQM adjustment. In reality, catastrophe model losses are complex functions of wind speed, incorporating multiple vulnerability curves, spatial variation, and secondary uncertainty prior to loss estimation. When using the FAQM operationally, a loss function would be carefully derived from the vendor model and applied only to the incremental wind speed adjustment. Total event losses are inherited directly from the underlying vendor model. As a result, the assumptions associated with the definition of the loss modification factor are limited in scope, as they affect only the incremental adjustment rather than the full hazard–loss relationship. A full assessment of the loss adjustment is beyond the scope of this paper. In contrast, resampling approaches preserve the full event-level hazard–loss relationships embedded in the underlying model.
The results presented in the following section should therefore be interpreted within the context of this simplified experimental design. In particular, the loss modification factor used to calculate the incremental loss for a given hazard represents an approximation relative to the loss modelling used in real catastrophe models.
3. Results and discussion
To assess the impact of the adjustment methodologies on insured losses, we evaluate changes to the occurrence and aggregate exceedance probability (OEP and AEP) curves at selected key return periods, as well as changes in the average annual loss (AAL). These statistics are calculated for four views: the IRIS 20-yr baseline, the IRIS +2°C climate-conditioned view which in this experimental setup is our “true” climate target, the category-based resampling adjustment, and the frequency aware quantile mapping (FAQM) adjustment. The two adjustment methodologies are evaluated in terms of how they modify the baseline view relative to the climate-conditioned reference under the simplified loss assumptions adopted here.
Figure 3 compares the adjusted loss metrics obtained using category-based resampling and FAQM with those derived directly from the climate-conditioned dataset. In this idealised experimental setup, in which the hazard-loss relationship is prescribed rather than modelled, the FAQM adjustment produces exceedance probability curves that closely align with the reference curves in terms of overall shape, particularly at higher return periods.
This behaviour is observed as all events in the FAQM approach experience a deterministic uplift in wind speed derived from the quantile mapping, whereas category-based resampling modifies the relative frequency of existing events without altering their individual severity. Under the simplified loss assumptions adopted here, this leads to a smooth redistribution of losses across the FAQM adjusted exceedance probability curves.
Figure 3(a) shows the OEP curves for the four views (i.e. the exceedance probability of annual maximum loss, as conventional for the insurance industry the probability on the x-axis is expressed in the form of a return period). Comparing the two resampling methods with the baseline and target curves this exercise shows that, under the imposed loss model, the hazard-adjustment component of the FAQM produces a stronger modification of losses at higher return periods than the category-based resampling approach and compares better with the climate-conditioned OEP curve. The underestimation of the climate-conditioned OEP by the category-based resampling approach to hurricane model adjustments is particularly relevant considering sensitivity analyses consistently show that increases in the frequency of the most intense hurricanes are the primary driver of projected growth in insured losses, even when total storm counts remain unchanged (Jewson, 2023b). This is due to the nonlinear relationship between wind speed and damage (Southern, 1979), whereby modest increases in storm intensity disproportionately affect average annual loss (AAL) and tail risk. Theoretical (Emanuel, 1987), observational (Elsner, 2020) and climate modelling studies (Ting et al., 2019, Balaguru, 2023, Knutson, 2020) suggest that the maximum wind speeds of tropical cyclones are likely to increase under continued warming, particularly among the most intense storms.
Figure 3(b) shows the corresponding AEP curves (i.e. the exceedance probability function of the annual aggregate loss). In figure 3(b) the FAQM-adjusted curve lies closer to the reference climate-conditioned curve, while the category-based resampling adjusted curve exhibits a more modest shift.
This difference is intuitive; in the FAQM approach every event has a wind speed-based loss uplift. Since the transformation function `H(v)` is greater than one for nearly all wind speeds this leads to a structurally amplified increase in risk. In the resampling approach events are duplicated from existing events, this leads to an increase in the chance of a high-loss year through random sampling, however its impact is limited because it cannot modify the severity of individual events.
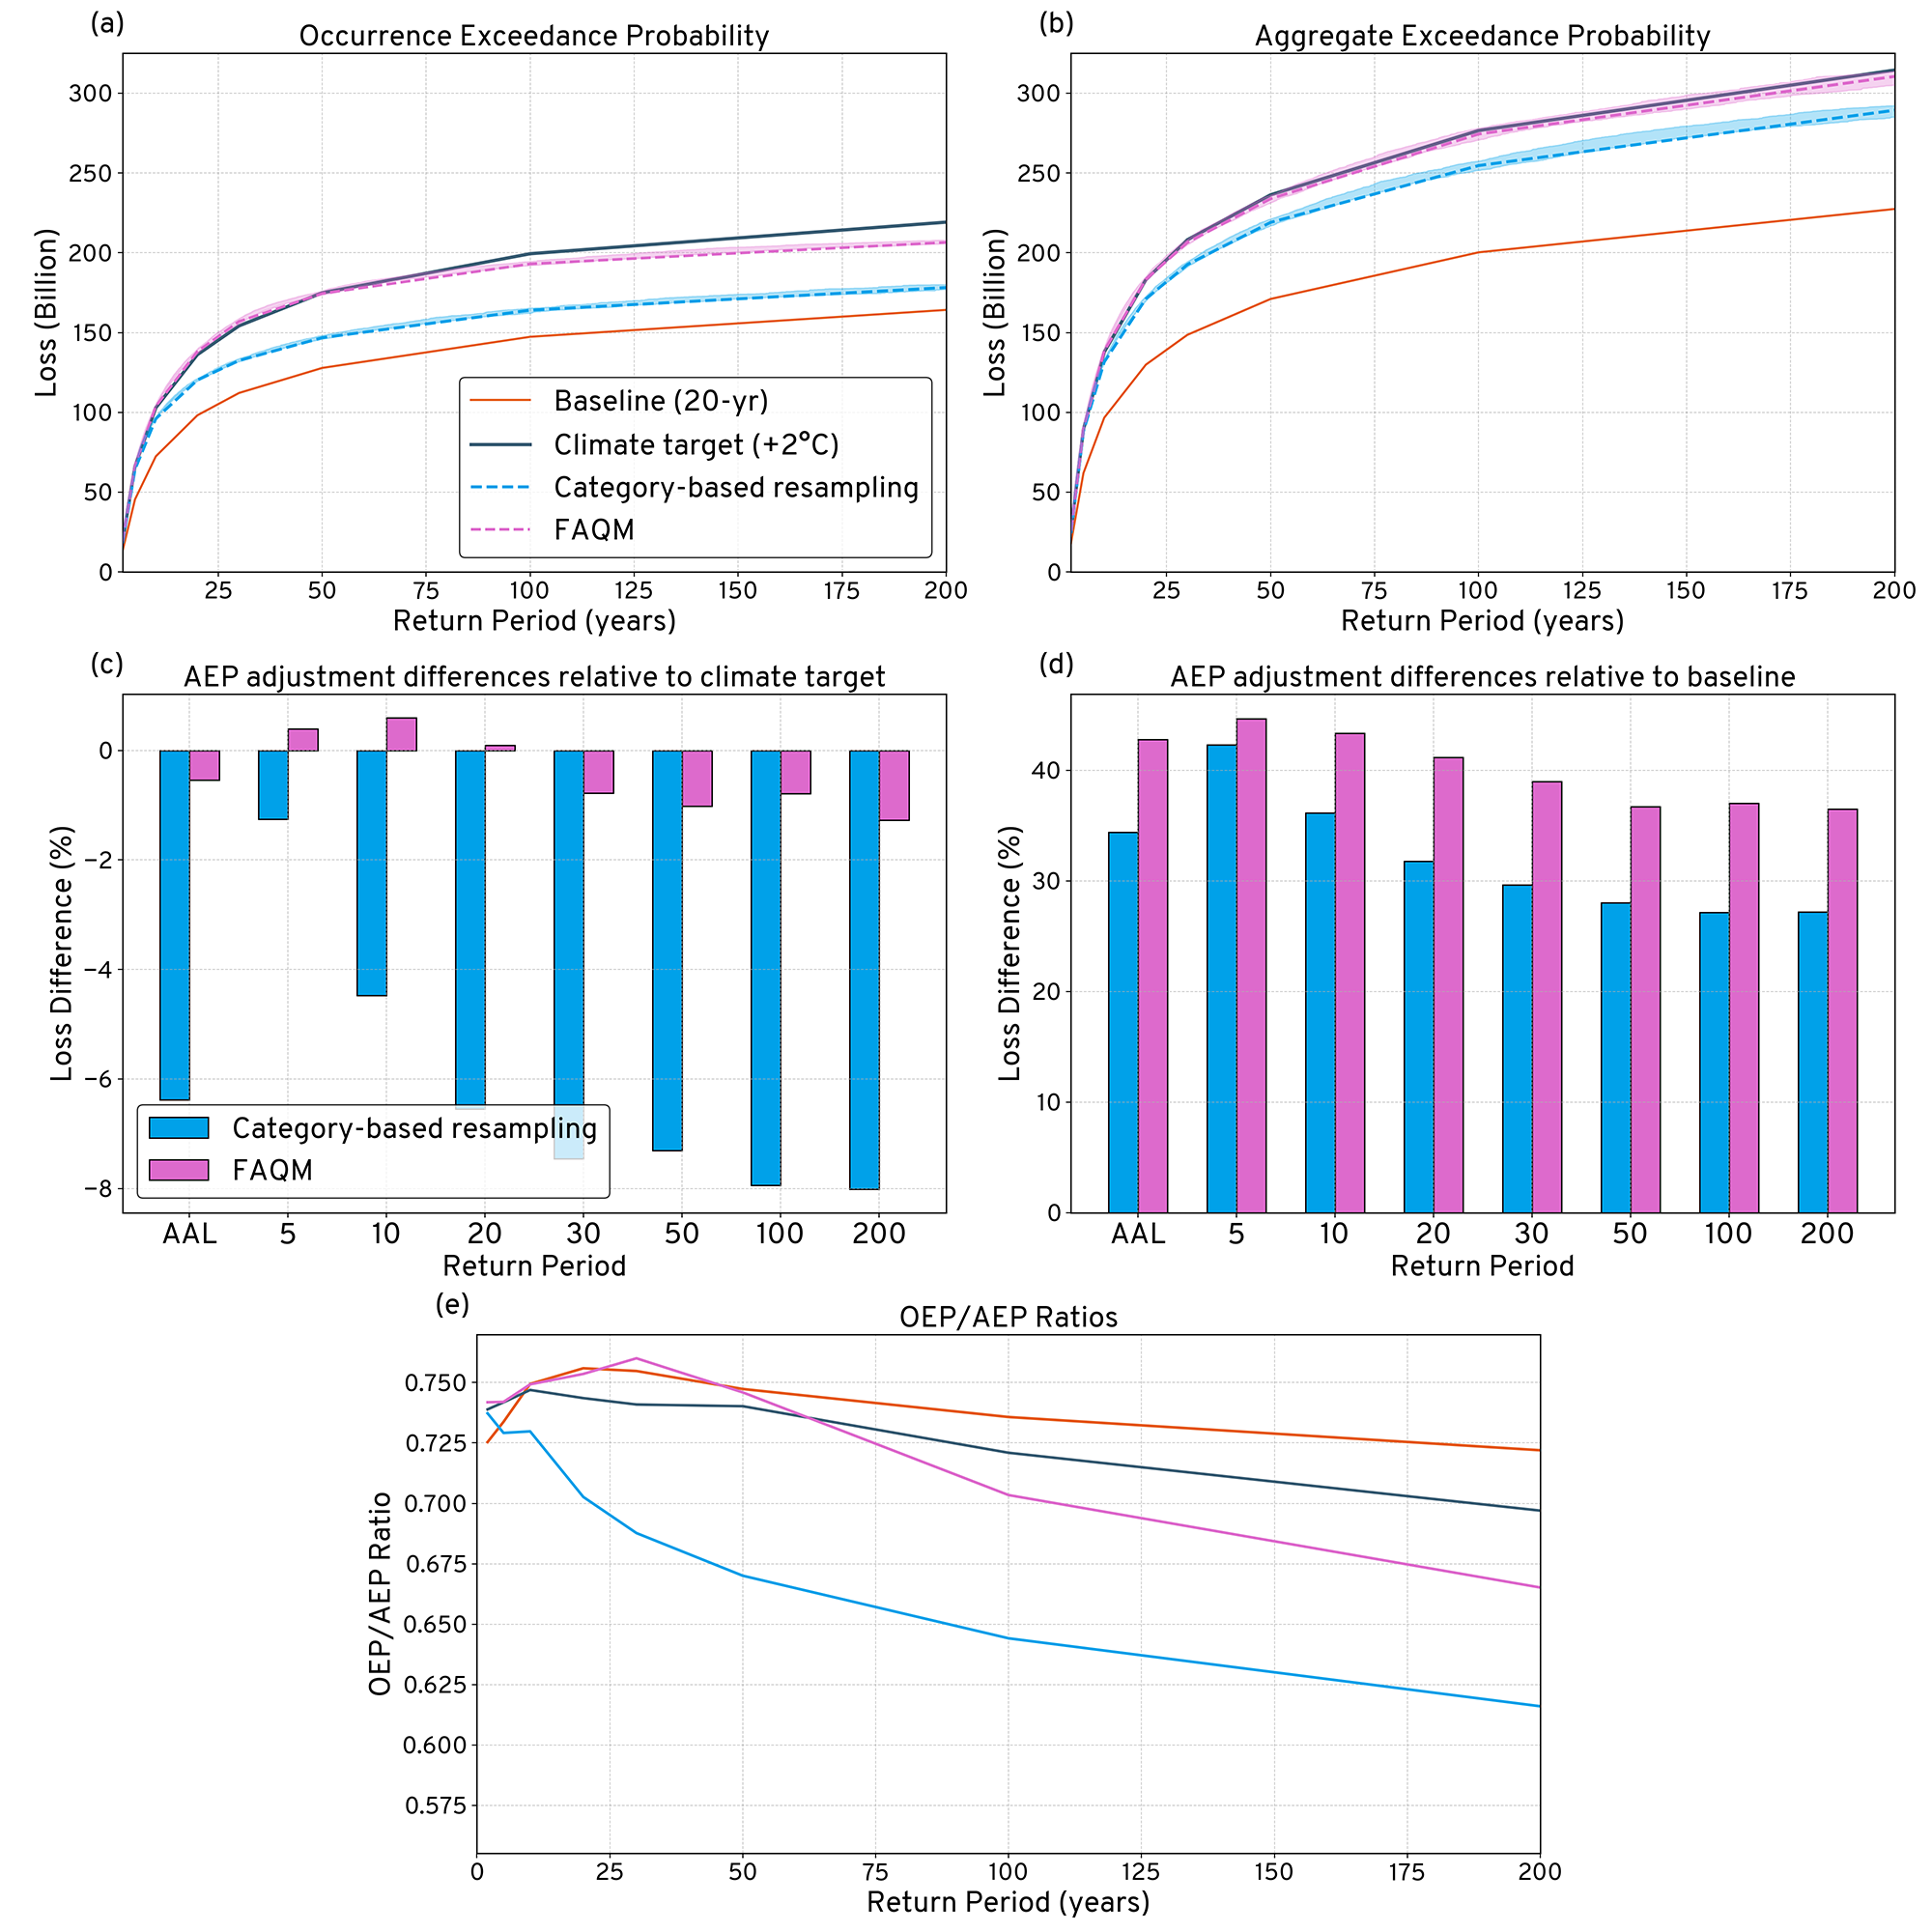
Figure 3: Figure 3(a) shows the OEP curves for the IRIS 20-yr baseline view (orange), our climate target the IRIS +2C view (grey), the category-based resampling adjustment (blue) and the frequency aware quantile mapping (FAQM) adjustment (pink), shading indicates a non-parametric confidence interval on the EP curves. Figure 3b is similar but for the AEP curves. Figure 3(c) shows the percentage differences for the AAL and selected key return periods between the category-based resampling, FAQM and the target climate view on an AEP basis; while Figure 3(d) shows the percentage differences adjustments to baseline. Figure 3(e) shows the ratios of OEP to AEP for each experiment.
Both adjustment methodologies result in increases in the AEP and AAL; however, the magnitude and shape of these increases varies between the methodologies. From Figure 3(d) we can see that the AAL increases by approximately 35% in the resampling approach compared with nearly 45% in the FAQM approach. In the category-based resampling approach the AEP percentage differences relative to the baseline decrease with increasing return period. This is a similar pattern as observed by Rye (2023); where increases in losses are concentrated at the lower end of the exceedance probability (EP) curve, with diminishing increases at higher return periods. This is a consequence of the shape of the EP curve, the category-based resampling disproportionately picks from the more frequent events that are clustered toward the lower end of the EP curve (including less impactful category 4 and 5 hurricanes) which are more likely to be selected during a purely stochastic resampling process.
In the FAQM approach, the percentage increases also decrease with return period although at a slower rate (Figure 2d). In the FAQM, the transformation function `H(v)` which maps baseline wind speeds to those under a warmer climate, is consistently above one and approximately linear over the wind speed distribution (Figure 2b). This results in a smooth and continuous increase in event severity across events, rather than the duplication of specific, randomly selected, events.
Figure 3(f) shows the ratio of the OEP to AEP curves for the four views. Up to approximately the 1-in-50-year return period, the FAQM-adjusted view exhibits a ratio closer to that of the climate-conditioned reference than the resampling-adjusted view. At longer return periods, the shapes remain broadly similar but diverge in magnitude. This behaviour likely reflects limitations associated with applying a single wind speed mapping function across regions with heterogeneous hazard characteristics. Preservation of the OEP/AEP ratio is relevant because it reflects the balance between single-event and multi-event loss years. In this idealised example, the FAQM produces ratios that are broadly consistent with the reference climate-conditioned statistics.
3.1 Results from regional quantile mapping of wind speed distributions
A further benefit of using statistically rich event sets to evaluate climate change impacts is that the analysis can be performed regionally. When relying solely on the published literature performing such a granular analysis is extremely challenging. As demonstrated by Pope and Phibbs (2025) it is now increasingly feasible to evaluate regional impacts.
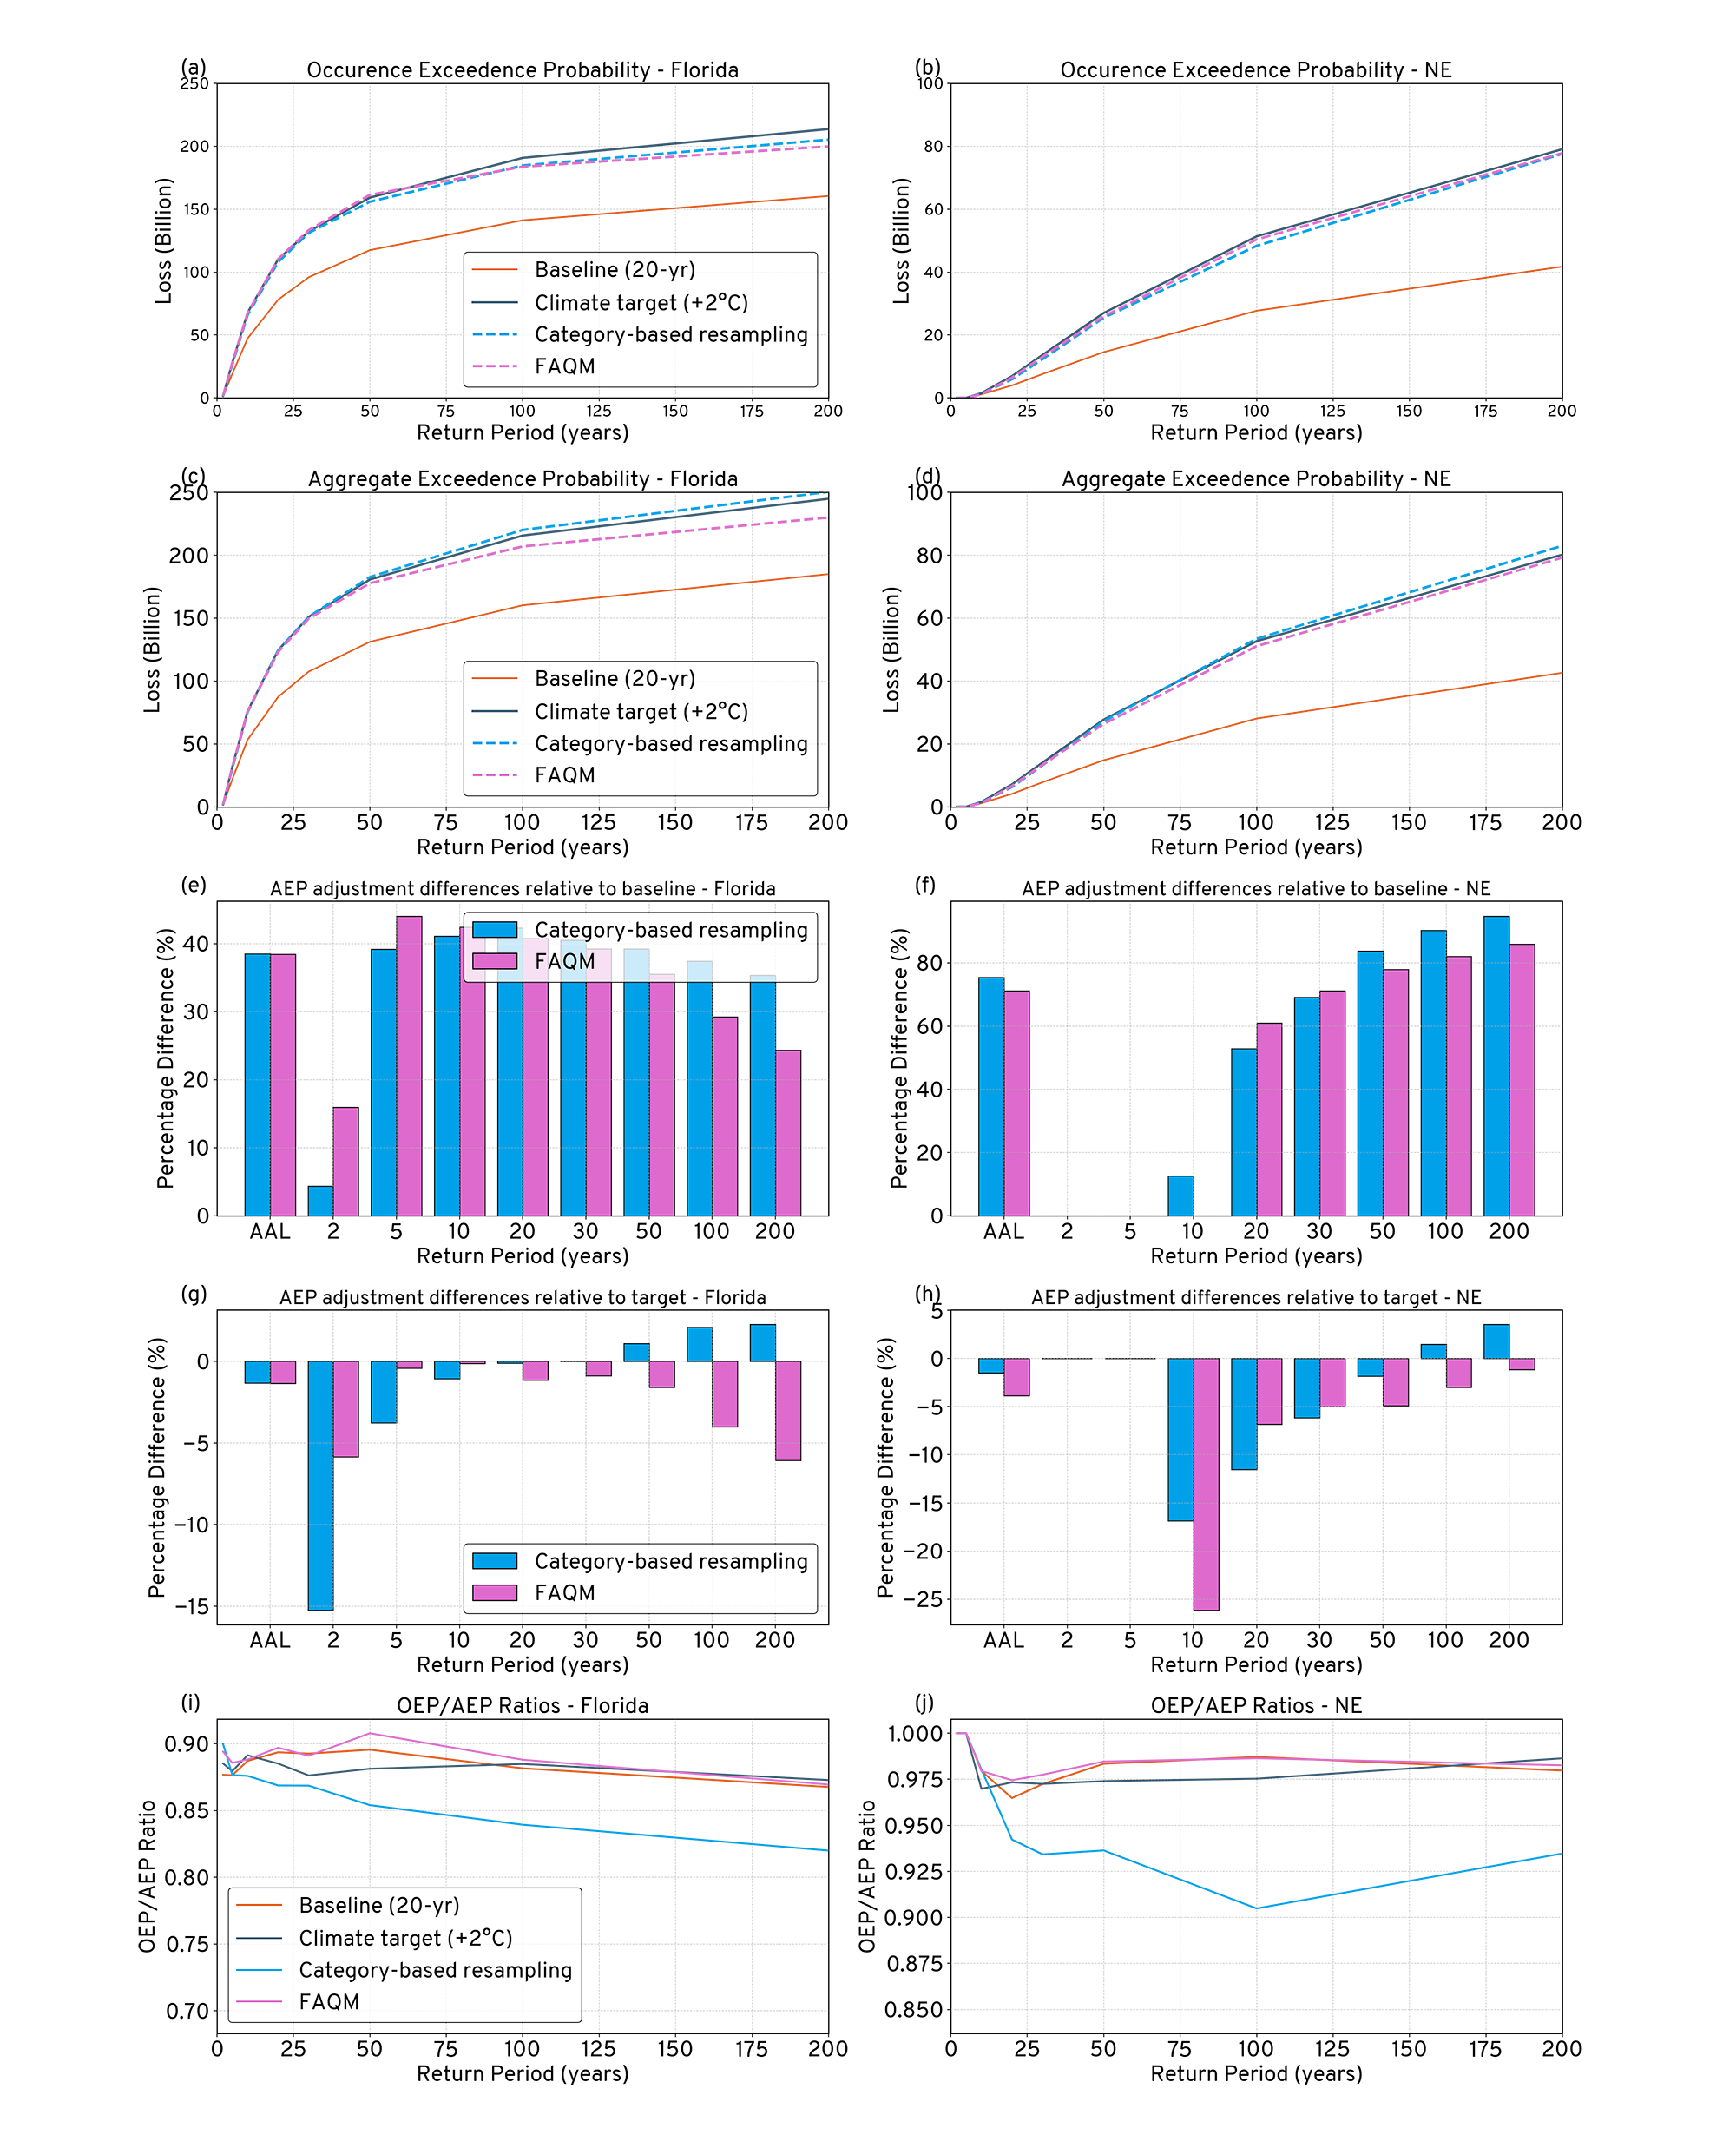
Figure 4: Comparison of occurrence and aggregate exceedance probability (EP) curve metrics for Florida (left) and the North-East (right) for the baseline (orange), climate target (grey), the category-based resampling (blue) and the FAQM (pink) views. The first row shows the OEP curves, the second row the AEP, the third and fourth rows indicate percentage differences to the AAL and AEP at key return periods for both adjustments relative to the baseline and climate target scenarios, and the bottom row shows the OEP/AEP ratios.
Figure 4 shows similar metrics to Figure 3, but this time for two different regions of the U.S.: Florida and the North-East. In the stochastic event set and YELT the events are tagged with whether they make landfall in the Gulf, Florida, South-East or North-East (defined from Virgina northwards). Both the category-based resampling and FAQM are performed independently within each region.
The two regions shown here represent contrasting levels of hurricane activity; Florida, which is highly exposed to hurricane losses and experiences frequent landfalls, and the North-East which experiences far fewer hurricanes. The regional changes in landfall rates for these regions are shown in Figure 1(c) - 1(e).
In Florida (the left column of Figure 4), which is a well-sampled region, we see very similar behaviour to the adjustment when applied U.S. wide (shown in Figure 3). Within the constraints of the experimental setup described earlier the FAQM well approximates the climate OEP and AEP, however it is noted that the percentage increase compared to the baseline decreases for both the category-based resampling approach and the FAQM. In Figure 4(i) we see that the OEP/AEP ratio from the FAQM adjustment well represents the climate-conditioned ratio without materially altering the relationship between single-event and aggregate losses. Beyond the 1-in-100-year return period this analysis suggests that both the category-based resampling approach and FAQM may underestimate tail losses from hurricane risk in a key (re)-insurance region. In Florida, the FAQM has a more homogenous event set compared with the U.S.-wide case; it may be overly constrained by localised sampling and under-estimating the extremes. It is also possible that for both the category-based resampling and FAQM that the tail of the loss distribution is saturated. These limitations highlight the challenges of representing extreme tail risk using statistical adjustment techniques and may be particularly relevant for catastrophe bonds and insurance-linked securities (ILS), where pricing and structuring are highly sensitive to the behaviour of the loss distribution at long return periods.
The North-East, in contrast to Florida, experiences relatively few hurricanes. However, it is a region that may become increasingly susceptible to hurricane risk under climate change (Balaguru, 2023). Figures 4(b) and 4(d) show the OEP and AEP curves for this region. Under the simplified loss assumptions used here, the FAQM adjustment produces a larger modification to the OEP curve than the category-based resampling approach, while the AEP curves from the two approaches are more similar. This likely reflects the small number of events contributing to aggregate losses in this region, such that both methods are influenced by the same limited set of extreme events.
Figure 4(f) shows a pronounced increase in the percentage difference of AAL and AEP relative to the baseline at higher return periods, highlighting the dominant role of a small number of events in shaping the tail of the loss distribution. This sensitivity to individual events is consistent with expectations for regions with sparse historical sampling.
Figure 4(j) shows that the OEP/AEP ratio produced by the FAQM adjustment is closer to that of the climate-conditioned reference than that produced by category-based resampling. This difference reflects the contrasting mechanisms of the two approaches. In the category-based resampling method, the need to increase the frequency of intense events in a sparsely sampled region can require repeated use of a limited number of category 4 and 5 events, which alters the balance between single-event and multi-event loss years. In contrast, the FAQM adjustment modifies the severity of all events deterministically, without repeating events, resulting in a different representation of the OEP/AEP relationship. These differences should be interpreted as structural consequences of the respective adjustment methods.
4. Conclusions
This paper has presented a frequency-aware quantile mapping (FAQM) approach for adjusting hurricane wind speeds and losses in catastrophe models. Frequency information is incorporated solely through severity-space adjustments to the wind speed distribution from a baseline view toward a climate-conditioned view. As a result, the FAQM method presented does not require adding or removing events to a given model stochastic set and is particularly useful when the number of model events must remain fixed.
Frequency changes implied by a climate-conditioned view are approximated indirectly through a redistribution of severity, typically prioritising the representation of more intense events at the expense of weaker ones. This compromise is acceptable for the purposes of pricing excess of loss treaties in reinsurance, which relies on the estimate of losses associated with the most extreme events. As with resampling approaches, the FAQM does not introduce new events or explicitly represent changes in the physical characteristics of the events such as storm size, track behaviour, precipitation intensity and depth, or storm surge severity.
In the idealised experimental setup described in this paper, the baseline and target event sets are derived from the IRIS stochastic set, with a known and uniform relationship between wind speed and loss. Under these assumptions, we compare the adjustment produced by the FAQM with a category-based resampling baseline. The latter method has fewer degrees of freedom by design, allowing only for the addition or removal of random events to match a target within broad wind speed ranges. It has been chosen here as a benchmark as it is known to be used widely in the insurance industry. The results shown in the previous section demonstrate that, within our experimental design, the AEP and OEP curves produced by the FAQM method more closely approximate the theoretical target than those obtained using category-based resampling, particularly in the tail of the OEP curve. The operational performance of the FAQM depends on how well the loss-modification factor captures the relationship between changes in hazard and resulting changes in loss. The results here are specific to category-based resampling; other resampling techniques may perform differently; a full assessment of alternatives is beyond the scope of this paper. Nevertheless, under the theoretical conditions examined in this paper, it has been demonstrated that the FAQM can address the model adjustment problem while maintaining a fixed underlying event-set count and provides a close approximation to the target loss distribution.
The results of this analysis indicate that the choice and implementation of adjustment methodologies can materially influence the resulting view of risk and therefore warrant careful consideration by (re)-insurers. Translating climate signals into catastrophe model loss estimates involves structural assumptions that are rarely made explicit. Understanding the implications and limitations of these assumptions is critical for robust risk assessment under climate change.
As catastrophe models evolve to incorporate richer spatial, temporal, and physical dependencies, preserving the internal structure of an event set may be desirable. Within the limitations discussed, the FAQM provides an operationally practical approach for exploring climate-conditioned loss sensitivity in settings where event counts must remain fixed.
References
Acknowledgements
The authors acknowledge the permission to use the IRIS data in this publication courtesy of Imperial College London and the Lighthill Risk Network.
Declarations
Handling Editor: Adam Sobel, Professor, Columbia University
The Journal of Catastrophe Risk and Resilience would like to thank Adam Sobel for his role as Handling Editor throughout the peer-review process for this article. We would also like to extend our thanks to the chosen academic reviewers for sharing their expertise and time while undertaking the peer review of this article.
Received: 4th July 2025
Accepted: 10th March 2026
Published: 14th May 2026
Rights and Permissions
Access: This article is Diamond Open Access.
Licencing: Attribution 4.0 International (CC BY 4.0)
DOI: 10.63024/rf3b-sgcj
Article Number: 04.02
ISSN: 3049-7604
Copyright: Copyright remains with the author, and not with the Journal of Catastrophe Risk and Resilience.
Article Citation Details
Petrie, R., et al., 2026. Assessing Climate Change Impacts in Hurricane Catastrophe Models Using a Frequency Aware Quantile Mapping, Journal of Catastrophe Risk and Resilience, (2026). https://doi.org/10.63024/rf3b-sgcj
Share this article: https://journalofcrr.com/research/04-02-Petrie-et-al/