



Abstract
We test the potential of a confidence-sensitive decision support tool for humanitarian anticipatory action, comparing the level and timing of alerts it would have triggered in advance of cyclone Kenneth landfalling in Mozambique in April 2019 against the alerts and actions taken historically. It demonstrates that even moderately uncertainty intolerant decision makers could have acted earlier had they employed the tool, potentially reducing the impact of the storm considerably.
1. Introduction
Anticipatory action (AA) refers to acting on forecast information before a disaster strikes with the aim of reducing its impact; for instance, by preparing for a cyclone making landfall before it hits the coast.1 AA promises to be a faster and more economical way of meeting humanitarian needs than traditional post-event disaster responses. The United Nations Office for the Coordination of Humanitarian Affairs (OCHA) estimates that every US$ 1 invested in AA could yield up to US$ 7 in avoided losses and added benefits (OCHA, 2025). AA can also significantly reduce the human cost and disruption to livelihoods, social systems, and economic structures. Red Cross-Red Crescent (RCRC) staff and stakeholders maintain that anticipatory action allows for faster responses, with partners in Bangladesh reporting that AA has reduced their cost of logistics and overall loss and damage relative to previous events (de la Poterie et al. 2023). For these reasons, anticipatory action is being increasingly advocated by humanitarian organisations such as the International Federation of Red Cross and Red Crescent Societies (IFRC), Start Network, and OCHA (IFRC, 2025; Start Network, 2024; OCHA, 2024).
Since AA is triggered by forecast information, accurate hazard forecasting is crucial. Complex ensemble forecasting methods have become more widely available to decision makers in recent years. Ensembles consist of a range of different models representing the same system which may disagree with respect to parameter values, initial conditions, or structural relations in the system. As it is often impossible to choose between these models based on the available evidence, forecasting is done using the entire ensemble rather than a single model. Therefore, the use of ensembles reflects scientific uncertainty about the target system. Model ensembles are used, for instance, by the European Centre for Medium-Range Weather Forecasts (ECMWF), the UK Met Office, and the Intergovernmental Panel on Climate Change (IPCC).
Even the most sophisticated model ensembles cannot achieve their potential unless combined with an effective tool to support decision-making under uncertainty. Efforts to develop model ensembles have not, however, been matched by similar efforts to develop instruments for effective decision-making based on model outputs. As a result, available forecasts often do not translate into adequate anticipatory action. In a recent paper, Roussos, Bradley and Frigg (2021) aimed to bridge the gap between forecasts and actions by formulating an effective decision-making algorithm for decision making under scientific uncertainty. This algorithm takes the forecasts from the models in an ensemble as input and translates them into possible decisions in a manner that considers both the confidence scientists have in the forecasts and the actors’ attitude to uncertainty. In the Innovate UK-funded project HIT: Leveraging New Global Cyclone Data to Create a Catastrophe Portfolio Management Platform, this decision-making tool is applied to AA in the face of tropical cyclones (where “HIT” is the acronym for Hazard Impact Tracker). To this end, the tool is combined with ensemble forecasts of storm characteristics generated by the ECMWF’s ensemble of numerical weather prediction models and implemented in an effective online platform that produces outputs which can be easily translated into decisions.
Decision-making concerning AA is complex. AA is set in motion by an alert issued based on the outputs of a forecasting system. This alert then must go through layers of political and logistical authority before enabling actionable decisions on the ground (such as evacuation orders). The complexities inherent in each layer of this decision chain are considerable and merit separate scholarly treatment. The focus of this paper is the upstream end of this decision chain: the criteria by which an alert is triggered and its character determined, based on the outputs models in an ensemble.
The challenges involved in translating model outputs into decisions is illustrated by responses to Cyclone Kenneth, which made landfall in Mozambique on 25 April 2019, only weeks after Cyclone Idai. Mozambique had institutional arrangements for anticipatory action in place, and it could rely on the high-quality forecasts of the ECMWF ensemble made available through Météo France La Réunion (MFR),2 the mandated Regional Specialised Meteorological Centre (RSMC) and the Joint Typhoon Warning Centre. Mozambique's Instituto Nacional de Meteorologia (INAM) is responsible for issuing national warnings based on the RSMC forecasts, and the Mozambique National Institute of Disaster Management (INGC) coordinates preparedness and response. And yet, humanitarian interventions were not initiated until a day before Kenneth made landfall – too late to provide effective disaster relief (Emerton et al., 2020).
We analyse the forecasts available at the time using the HIT decision tool and then write a counterfactual narrative of what alerts would have been triggered, and when, had the HIT decision tool and its recommendations been available and followed, comparing it to what actually happened. The results are striking. The analysis consistently recommends issuing all levels of alerts much earlier than was the case and demonstrates how such a decision framework could have supported more timely interventions in anticipation of the impact of the storm.
1: AA is distinct from general disaster preparedness, which involves building the resilience of people and communities through strategic long-term planning. In the current context, AA involves taking specific actions triggered by early warning systems shortly before a disaster. Such actions may include reinforcing water lines with sandbags, installing storm shutters on homes, activating backup power systems and response teams, stocking emergency shelters with food, and evacuating vulnerable populations. These measures can be facilitated by the release of pre-approved funds (Thalheimer et al., 2022). The availability and effectiveness of interventions also depends on the lead time, with different actions being effective at different lead times. A discussion of different lead-time dependent combinations of actions is beyond the scope of this paper.
2: MFR’s implementation of its regional model relies on the ECMWF global Integrated Forecasting System for both initialisation and lateral forcing (Faure et al., 2020). Its official cyclone forecasts are however built as a multi-model consensus that draws on the outputs of many centres, including the ECMWF, Météo-France, and the UK’s Met Office (Conroy et al., 2023).
2. Cyclone Kenneth
Cyclone Kenneth made landfall in northern Mozambique as a category 4 cyclone with recorded maximum wind speeds of just over 60 m/s. Immediate wind damage was severe and subsequent multi-day rainfall impeded impact assessments. Government and UN reporting indicate that approximately 373,000 people were affected, with an estimated 45,000 houses destroyed and 19 health facilities in the north and 93 health facilities in central provinces damaged (UNICEF, 2019a). These impacts compounded pre-existing pressures from Idai. Across the two cyclones, there were 2.5 million in need of humanitarian assistance, including 1.3 million children (UNICEF, 2019b). Public-health risks escalated accordingly—most notably with cholera—prompting large-scale vaccination campaigns and water sanitation and hygiene (WASH) interventions. In all, Kenneth turned out to be the strongest cyclone to make landfall in the country since modern records began, claiming over 50 lives and causing an estimated US$ 345 million worth of damage (Nhundu et al., 2021).
Yet, Cyclone Kenneth did not strike undetected. As early as 17 April, MFR identified a possible storm vortex. On 21 April, MFR declared the system a tropical disturbance and, on 22 April, a tropical storm. On 23 April, both MFR and JTWC declared it a category 1 tropical cyclone.3 Warnings and actions came later. INAM issued the first general warnings on 21 April, but it took a further two days, until 23 April, for the Global Disaster Alert Coordination System (GDACS) to issue an Orange Alert (SADC, 2019) and until 24 April for the Mozambique Disaster Management Coordination Council (CCGC) to meet (Club of Mozambique, 2019). Following the meeting, the government finally declared a national Red Alert in the North. Individuals in 17 districts in Cabo Delgado and Nampula Provinces were warned to evacuate, and other measures such as supply deployment followed (World Bank, 2019).
There have been several assessments of both the forecasting of Kenneth’s trajectory, timing and severity and of the humanitarian response to it (e.g. Emerton et al., 2020; Hope, 2019; Norton et al., 2020; WHO, 2021). Our focus is different. It is striking that actions were not set in motion much before Kenneth made landfall, leaving insufficient time to provide effective protection. So we ask a different question: could the alerts have been triggered earlier, given the forecasts, allowing anticipatory actions to start sooner?
3: This account is based on Emerton et al. (2020) as well as reports from MFR and JTWC that were available on their websites at the time (and are now available through Wayback Machine here: https://web.archive.org/web/20260000000000*/http://www.meteo.fr/temps/domtom/La_Reunion/webcmrs9.0/anglais/activiteope/bulletins/).
3. The HIT framework for decision-making under uncertainty
The HIT decision tool builds on the confidence-sensitive framework for decision-making under scientific uncertainty developed in Hill (2013, 2019) and Bradley (2017) and applied to natural catastrophes in Roussos et al. (2021) and to insurance in Bradley (2025). The framework separates three key considerations in making decisions supported by scientific forecasts of the values of decision relevant variables: the uncertainty contained in the forecasts, the nature and magnitude of what is at stake in the decision, and the attitude of the decision maker to scientific and other uncertainty in the light of the decision stakes (their cautiousness or uncertainty intolerance). Its core insight is that the level of confidence that we require to act depends on what is at stake.
The account is schematically summarised in Figure 1. The left-hand branch is the science branch; the right-hand branch is the agent branch.
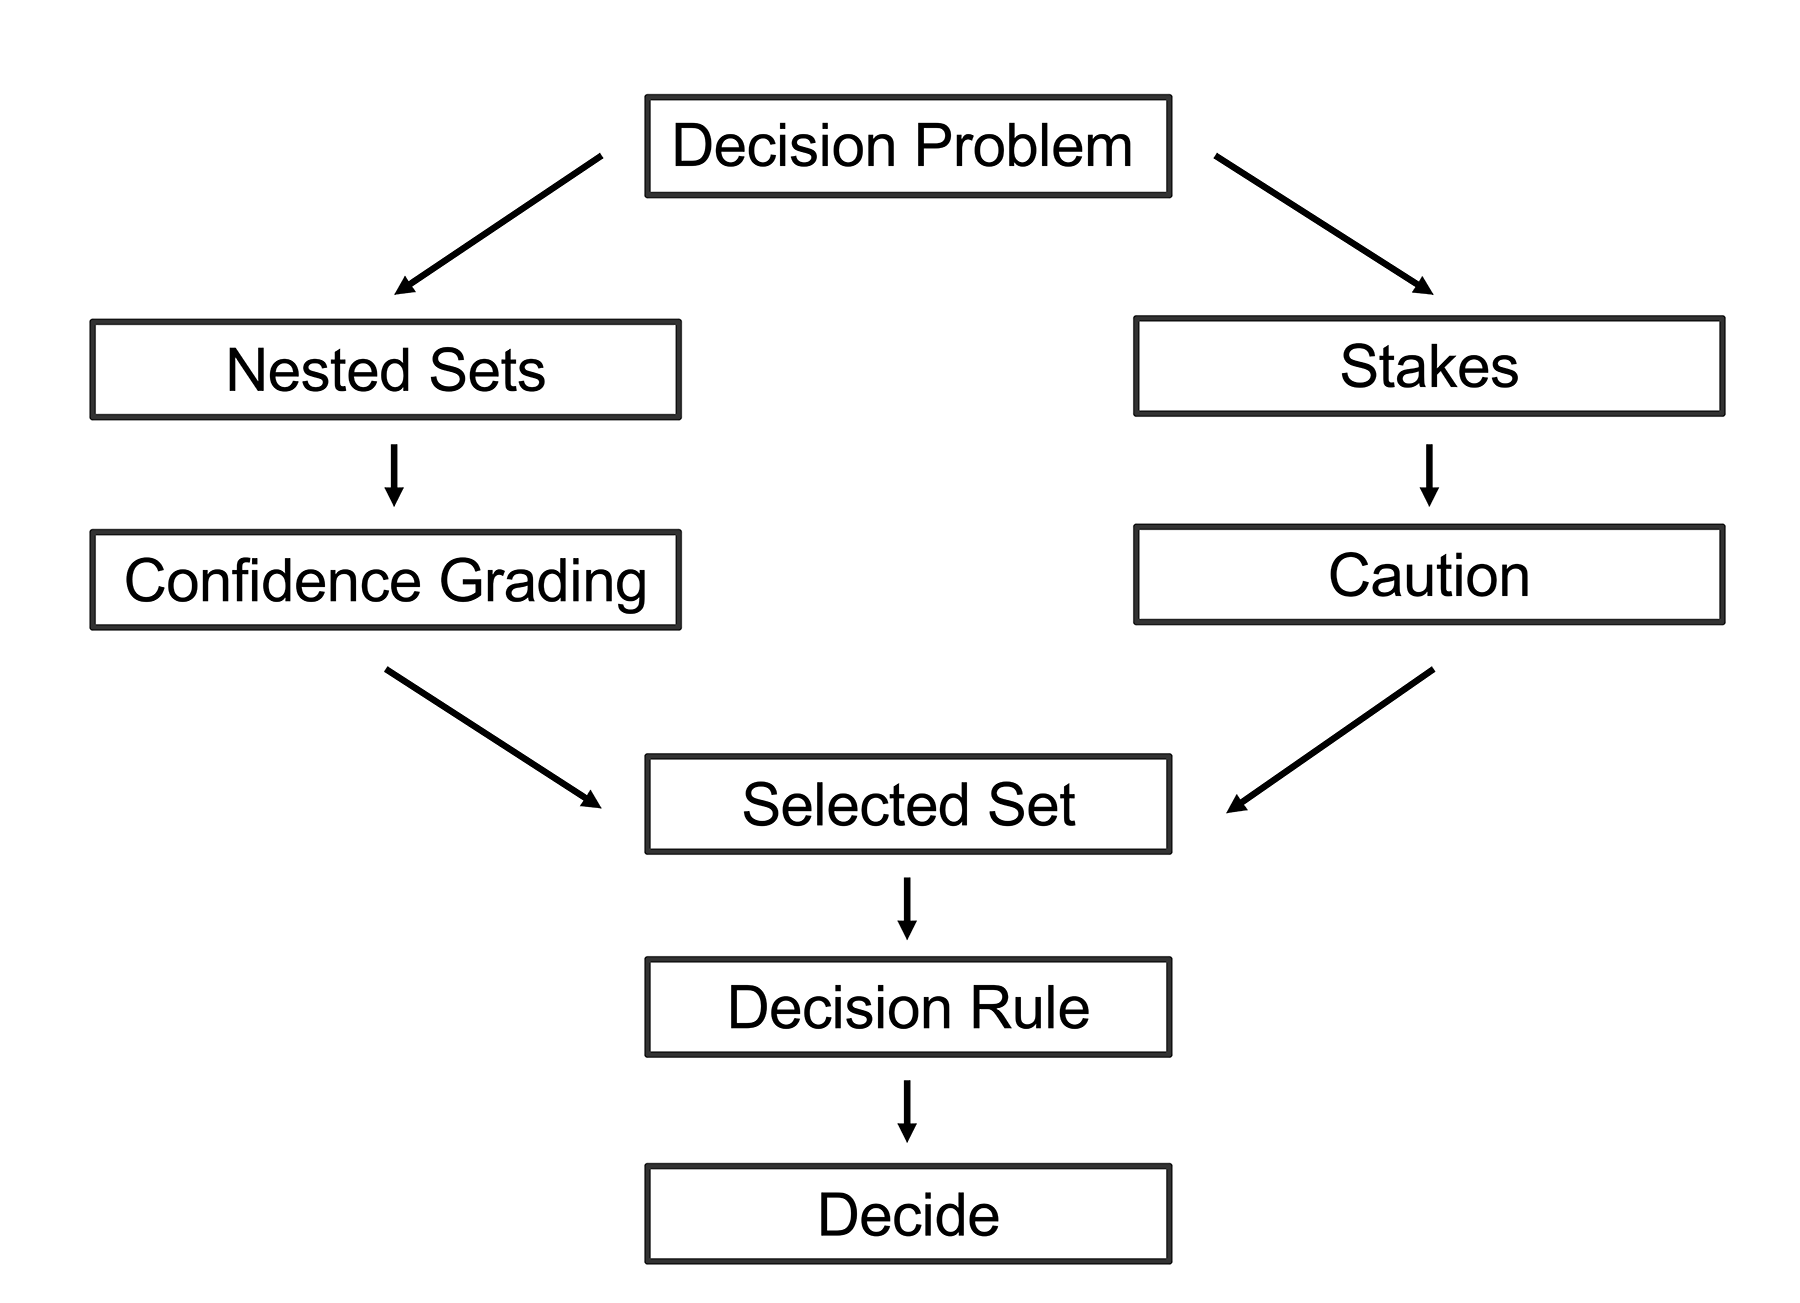
Figure 1: Framework for Confidence Sensitive Decision Making
In the science branch, the uncertainty contained in the forecasts is assessed by first forming nested sets of the potential outcomes and then confidence grading them. In the context of cyclones, we consider variables like one-minute sustained maximum windspeed, central pressure, and precipitation. These are positive real numbers and so the nested sets are nested intervals. In the current context, we’re primarily interested in the maximum value a variable assumes and so for simplicity the lower bound of the interval will be set to zero even if the lower bound on forecasts is higher than this. This case is schematically represented in Figure 2 where three intervals are displayed, with decreasing upper bounds running down from the upper-most one.
In this study, we restrict attention to maximum windspeed as a single variable (to be precise, the one-minute sustained maximum windspeed). The choice of maximum windspeed has the advantage that it does capture a crucial characteristic of hurricanes; that is the standard variable used internationally; and that it is easily understood by stakeholders.4
The next step is to consider the available scientific evidence in order to confidence grade these intervals. Each interval represents a judgement, based on this evidence, as to the range of possible values the variable might take. Since a narrow interval represents a more precise estimate than a wide one containing it, but is based on the same evidence, it must be less certain. It must therefore afford lower confidence than the less precise one. Indeed, logic dictates that narrower intervals cannot warrant higher confidence than larger intervals. (Conversely, more precise judgements are warranted in cases when the evidence is plentiful, rather than in those in which it is sparse – this explains the common association between more precision and less uncertainty.)
For simplicity, HIT uses a three-tier grading system of low, medium, and high confidence, as illustrated in Figure 2, to represent the uncertainty around wind speed forecasts. Here the inner-most interval warrants lowest confidence because it gives the most precise estimate of the variable; while the outermost and middle intervals are assigned high and medium confidence respectively.

Figure 2: Confidence-graded nested intervals of forecasted variables
The agent branch of Figure 1 accounts for the nature and magnitude of what is at stake in the decision, and the attitude of the decision maker to scientific and other uncertainty in the light of the decision stakes (their cautiousness or uncertainty intolerance). While the assessment of uncertainty in the forecasts is a scientific task, the decision stakes and an agent’s cautiousness are features of specific decision situations and decision makers, and in practical applications will have to be elicited.
The two branches converge at the bottom, where the decision-relevant interval is selected based on what is at stake in the decision problem for the decision maker and how cautious they seek to be in such circumstances. A decision maker with low tolerance for uncertainty can work with a wide interval of projections and test whether an intervention can be expected to achieve its goals across the full interval, i.e. irrespective of where in the interval the true value of the variable lies. The higher the stakes, and the more cautious the decision maker, the more confidence in the projections required for selection of an intervention and hence the wider the chosen interval of projections against which these interventions are assessed. Finally, a decision rule is applied to the selected interval, which leads to the decision. A number of rules are available for this last step, a common one being the maximisation of minimum expected utility. 5
4: In future studies, it would be advantageous to also include other variables, particularly precipitation. However, we note that focusing on maximum wind speed does not affect the essential conclusion we draw about Kenneth in the next section. While it is difficult to differentiate precisely between damage caused by wind and rainfall, reports covering 25–26 April estimate that over 30,000 people were evacuated, houses in Quissanga were extensively damaged, many homes in northern Mozambique collapsed, and Pemba lost its power supply before torrential rainfall began on 27 April (Humanity Road 2019; UNICEF 2019c).
5: For discussion of other options, see Bradley (2017).
4. Applying the HIT framework to cyclone Kenneth
In the application of the framework to humanitarian action in anticipation of tropical cyclones, we focus on decisions about whether and when alerts should be triggered, given projections about the nature and severity of the impending storm and of its impact on different geographical areas. Since anticipatory action requires a support infrastructure that can be mobilised to implement the chosen interventions, it is natural to consider areas covered by a single (or at least well-connected and coordinated) support network, such as a country and its administrative districts. We therefore worked with the administrative districts of Mozambique, with a focus on Cabo Delgado, the area that suffered the brunt of the storm.
In this study we use the alert scoring method associated with the Global Disaster Alert and Coordination System (GDACS). The system uses traffic-light alerts – green, amber and red – which effectively correspond to estimated humanitarian impact, and hence to the urgency to take action. The system is summarised in Table 1 below (see GDACS, 2026). The GDACS classification neatly maps onto different parts of the confidence approach: the maximum windspeed is the variable for which intervals are formed, and the combination of population size and vulnerability constitute an operationalisation of the stakes (the larger the population and the greater the vulnerability, the higher the stakes).6
| Alert Level | Wind Speeds (m/s)** | Population | Vulnerability |
|---|---|---|---|
| Green | 17.5-33 | < 10M | Low - Medium - High |
| Orange | 17.5-33 | > 10M | High |
| Orange | 33-49 | > 100k or 10% of population | Medium - High |
| Orange | 49-58 | > 1M | Low |
| Red | 33-49 | > 1M | High |
| Red | 49-58 | >100K or > 10% | Medium-High |
| Red | 58-70 | > 1M | Low |
In what follows, we do not make any assumptions about the decision maker’s cautiousness and instead produce analyses for three different kinds of decision maker: those who are intolerant of scientific uncertainty, those who are only moderately intolerant of it, and those who have a high tolerance of it.
As regards the stakes, in this exercise we assumed medium-high vulnerability of the (greater than 1 million) population of Cabo Delgado. As of 2017, JRC’s INFORM Risk Model – which ranks countries based on Hazard & Exposure, Vulnerability, and Lack of Coping Capacity using over 50 indicators – gave Mozambique a score of 6.0 out of 10 (Marin-Ferrer et al., 2017). Arguably this may be too conservative for this context given the prior damage inflicted by storm Idai, but assuming high vulnerability instead does not much affect the main comparisons we draw.
To determine the windspeeds used in an application of GDACS we draw on the confidence graded intervals of forecasted maximum windspeeds (on certain dates, for different lead times, for Cabo Delgado) provided by the science branch of the HIT framework. These intervals in effect convey the following kind of information: at confidence level L (where L can be high, medium, or low), the maximum windspeed will not lie outside the corresponding interval. This is tantamount to saying that at confidence level L one can rule out windspeeds above the upper bound of the corresponding interval. HIT triggers an alert, for a decision maker with confidence requirement L, when windspeeds meeting the GDACS windspeed condition for an alert of that kind cannot be ruled out with that level of confidence.
To numerically determine the intervals for the study of Kenneth, we used forecasts of maximum wind intensities produced by running the TRACK code developed at Reading University on data from the ECMWF 51-member model ensemble.7 The cyclone track forecasts were bias-corrected for systematic differences between the ECMWF model results and observed historical data (i.e. the International Best Track Archive for Climate Stewardship, IBTrACS). The quantile delta mapping method was used. Quantile-based methods adjust model forecasts by matching the probability distribution of the forecasts with observations, and they have the advantage of increasing the ensemble spread, thereby better encompassing uncertainty in real-world hurricane intensities (Cannon et al., 2015).
The ECMWF ensemble generated 51 different forecasts twice a day (at midnight and midday); the bias-corrected spread in generated values reflecting the uncertainty in the forecast. To capture this uncertainty, we constructed, for different lead times, nested intervals of forecasted values for one-minute sustained maximum windspeeds in the Cabo Delgado region at a particular date, generated by incorporating forecasts around the mean and at increasing statistical distance from it. For reasons outlined in Section 6.2.2 of Roussos et al. (2021), HIT uses statistical nesting: calculate the means and variance σ of the 51 model outputs for given lead time T, and calculate the upper bound of the low, medium, and high confidence intervals by, respectively, adding `1/2 sigma`, `sigma`, and `3/2 sigma` to the mean. Drawing on this construction, the HIT platform then outputs, for the chosen time and date of model run, a table of the upper bounds of the intervals of Kenneth’s forecasted one-minute sustained maximum windspeeds, for each confidence level and lead time, together with the associated alert level.
6: The velocity bands considered in the GDACS system are those also used in the Saffir-Simpson scale to classify cyclones. However, in the context of HIT we focus on the maximum windspeed in a given administrative district, and the windspeeds in that district can be different from the maximum windspeed found anywhere in the cyclone. Since the latter will be used to classify the cyclone as belonging to a certain category, the GDACS system as applied in HIT does not operate with these classifications.
7: See Hodges and Emerton (2015) for details.
5. Comparison
In the confidence-based decision framework, the timing and level of alerts recommended on the basis of forecasts of storm severity depend on the decision maker’s uncertainty intolerance. As indicated above, in this implementation we produced recommendations for decision makers operating at three different levels of uncertainty intolerance: high, medium and low. To each level corresponds a requirement of confidence in the forecasted values of the physical variables on which the decision depends: high confidence for those highly intolerant of uncertainty, medium confidence for those moderately so, and low confidence for the tolerant. The GDACS is then applied using the upper-bound of the intervals of maximum windspeeds picked out by each confidence requirement, together with our assumptions about the population of Cabo Delgado and its vulnerability. Doing this for each forecast date and time and each lead time, yields the ‘counterfactual narrative’ exhibited in Table 2 below of what alerts would have been issued if the HIT decision algorithm had been employed by, or for, each kind of decision maker.
Table 2 also offers a comparison of this counterfactual sequence of alerts with those that would have been issued had the GDACS been used in conjunction with the historical MFR forecasts.8 For the counterfactual history, we record for each uncertainty intolerance (or cautiousness) level, the storm level associated with the upper bound of the corresponding confidence interval, together with alerts implied by the GDACS scoring for such a storm level. We only display the highest alert level and the first day on which that alert level is issued for an uncertainty intolerance level for a particular lead time. For the historical account, we report the storm category for which the alert is issued and corresponding implied alert level that is obtained by applying the GDACS to the historical MFR forecast. We again only record the earliest day for which an alert is issued.
| Historical | Counterfactual | |||||
|---|---|---|---|---|---|---|
| Date-Time | MFR Forecast | Uncertainty Intolerance | ||||
| High | Medium | Low | ||||
| 18/04 | `T=9` | |||||
| 19/04 | `T=7` | |||||
| 20/04 | `T=4` | `T=5` | ||||
| 21/04 | `T=4` | `T=4` | `T=4` | |||
| 22/04 | `T=3` | `T=3` | `T=3` | `T=3` | ||
| 23/04 | `T=2` | `T=2` | `T=2` | `T=2` | ||
| 24/04 00:00 | `T=1` | `T=1` | `T=1` | `T=1` | ||
| 24/04 12:00 | `T=0` | `T=0` | `T=0` | `T=0` | ||
| 25/04 00:00 | `T=0` | `T=0` | `T=0` | `T=0` | ||
Under a derived counterfactual narrative about decision makers who are responsive to such alerts, a decision maker with a high intolerance for uncertainty might have begun anticipatory action on 18 April; a decision maker with medium intolerance on 20 April; and one with low intolerance on 21 April. More significant interventions might have followed on 21 April for those of high uncertainty intolerance, and on 22 and 23 April for those of medium and low intolerance respectively. In contrast, the analysis with the historical forecasts would imply first action only on 22 April and escalated the day after. What actions would or could have been taken in response to these alerts depends, of course, on all sorts of factors that fall out of the scope of this exercise. In summary, the anticipatory management of cyclone Kenneth recommended by HIT differs not only from what actually happened, but also from what the actual historical sequence of forecasts suggests should have happened, and significantly so under both a high and medium confidence requirement. Determining the extent to which these differences can be attributed to the confidence sensitivity of the HIT algorithm is complicated by the additional factors influencing decision making and by the fact that MFR based its advisories on an ‘official’ track obtained by manual synthesis of the outputs of various meteorological centres including, but not limited to, those of the ECMWF (see Conroy et al., 2023; Faure et al., 2020). Nonetheless, the extent of the divergence is strong evidence that confidence-sensitivity can make a significant difference to the timing of alerts and, as a consequence, that adhering to HIT’s recommendations could have allowed for more effective anticipatory action – or at least more informed decision making – with the potential to significantly reduce impacts on lives and livelihoods in Cabo Delgado.
8: These are all available via the Wayback Machine here: https://web.archive.org/web/20260000000000*/http://www.meteo.fr/temps/domtom/La_Reunion/webcmrs9.0/anglais/activiteope/bulletins/
6. Limitations
The study in this paper has a number of limitations. The first is that the only variable considered in the current version of HIT is the one-minute sustained maximum windspeed. This choice has the advantages that it captures a crucial characteristic of hurricanes; that it is the standard variable used internationally; and that it is easily understood by stakeholders. In future iterations it would, however, be advantageous to include other variables, notably precipitation and central pressure. The generalisation of the trigger conditions used in HIT to multiple variables is straightforward and can be implemented without difficulty once the relevant information is available as model outputs.
The second limitation is that only sparse attention has been paid to the question of robustness. The current study focuses on how HIT performs in the context of cyclone Kenneth, and we have carried out similar studies for two other storms: cyclones Mocha and Yagi. These studies yield the same overall conclusion as Kenneth – that adhering to HIT’s recommendations could have allowed for more effective anticipatory action – but it would be advantageous to have this conclusion confirmed on a larger set of storms, including ones that dissipated earlier than anticipated.
A further aspect of robustness concerns the choice of parameters in the system, in particular the construction of the upper bounds of the nested sets through the choice of adding `1/2 sigma`, `sigma`, and `3/2 sigma` to the mean. We have varied these bounds by both adding and subtracting 2 m/s to these bounds and found that the conclusion remains unchanged under this variation, but further work is needed to test the robustness of the recommendations, and explore the limits of their robustness. Indeed, considering a range of hazard intensities does not automatically imply robust decision-making, and robustness could be defined in many ways (McPhail et al., 2018). This study has only considered the natural scientific uncertainty and set aside the problem of fully weighing costs and benefits of different interventions. Doing so is a project for future research.
Finally, taking as case studies storms that are known to have made landfall at intensities of humanitarian concern, gives a one-sided picture of the usefulness of the platform since these represent cases in which early intervention would have been beneficial. The other side is storms that don’t form, dissipate or don’t landfall and where triggering an intervention would have been costly. Future research will aim to rectify this by running the algorithm over an entire season or even year to get a measure of the potential costs of ‘over-triggering’ of alerts.
References
Acknowledgements
The research reported here was supported by an Innovate UK grant for HIT: Leveraging New Global Cyclone Data to Create a Catastrophe Portfolio Management Platform.
We are grateful for comments on this paper by Kevin Hodges, Tom Philp, Giacomo Favaron, Valentina Noacco and Mutahar Chalmers.
Declarations
Handling Editor: Adam Sobel, Professor, Columbia University
The Journal of Catastrophe Risk and Resilience would like to thank Adam Sobel for his role as Handling Editor throughout the peer-review process for this article. We would also like to extend our thanks to the chosen academic reviewers for sharing their expertise and time while undertaking the peer review of this article.
Received: 3rd October 2025
Accepted: 17th August 2026
Published: 1st October 2026
Rights and Permissions
Access: This article is Diamond Open Access.
Licencing: Attribution 4.0 International (CC BY 4.0)
DOI: 10.63024/m59g-5apn
Article Number: 04.09
ISSN: 3049-7604
Copyright: Copyright remains with the author, and not with the Journal of Catastrophe Risk and Resilience.
Article Citation Details
Bradley, R., et al., 2026. Confidence-Sensitive Anticipatory Responses to Cyclone Kenneth: A Counterfactual Analysis, Journal of Catastrophe Risk and Resilience, (2026). https://doi.org/10.63024/m59g-5apn
Share this article: https://journalofcrr.com/research/04-09-Bradley-et-al/