


Abstract
North Atlantic hurricanes rank among the costliest natural hazards. Their impacts have increased over recent decades and are projected to rise further with climate change. Yet catastrophe models used in (re)insurance remain largely static, reflecting historical climate with limited integration of near-term climate signals. We present a simplified tropical cyclone model to estimate climate-connected landfall rate changes for North Atlantic hurricanes. Using reanalysis and climate model data, we quantify hazard changes for near-present (+1.2°C) and future (+2°C) climates relative to the historical baseline (1980–2025). These changes are used to adjust a year event loss table with a static view of risk by resampling. We find the average annual loss increases by 15% in the near-present (+1.2°C) climate, and the 1-in-10-year loss increases by 11%. Results show substantially higher landfall and loss increases under future (+2°C) climate than previous studies, highlighting the critical but often overlooked role of frequency changes in hurricane risk assessment.
Key points:
- Simplified hurricane model using physical proxies shows losses rise 15% due to near-present climate adjustment (+1.2°C) and 44% for +2°C.
- Hurricane frequency change plays a critical yet poorly understood role in North Atlantic hurricane risk in a warming climate.
- Resampling can adjust static event sets to near-present climate but underestimates extremes; spatial models better capture tail risk.
1. Introduction
Tropical cyclones (TCs) are among the costliest natural hazards globally, with the North Atlantic basin accounting for a substantial share of insured economic losses. Between 2010 and 2019, TCs caused over US$573 billion in economic losses globally (WMO 2024). North Atlantic TCs have historically contributed close to one-third of the global annual insured property losses since 1970 (Comola et al., 2024,). Their adverse impacts have increased over recent decades. In the United States, TC-related damages normalised by individual wealth, population and inflation have increased by approximately 1% per year, tripling over the period from 1900 to 2022 (Willoughby et al., 2024).
Climate change is identified as one of the key drivers of this long-term trend (Meiler et al., 2025; Willoughby et al., 2024). North Atlantic TCs are fuelled by high sea-surface temperatures (SST) and impacted by phenomena like the El Niño Southern Oscillation (ENSO) and the Atlantic Multidecadal Oscillation (Lin et al., 2020; NOAA 2023). Record-high SSTs in the North Atlantic and a predicted shift to La Niña conditions ahead of the 2024 season raised concerns about a “hurricane season from hell” (Carbonaro 2024; Insurance News Net 2024; WeatherBELL Analytics, LLC. 2023). The 2024 Atlantic hurricane season was indeed the ninth consecutive year with above-average activity, featuring 18 named storms, 11 hurricanes, and five major hurricanes, well above the 30-year (1991–2020) average of 14 named storms, seven hurricanes, and three major hurricanes (NOAA 2024; WMO 2024). This trend raises the question: are we witnessing a climate-driven change in the baseline of TC activity in the North Atlantic basin and what would this imply for the (re)insurance sector?
There is growing scientific consensus that TC intensity is increasing globally and will likely continue to rise in a warming climate, leading to a higher frequency and proportion of very intense TCs (category 4–5 on the Saffir-Simpson Hurricane Wind Scale, Knutson et al., 2020). Water-related TC sub-hazards, such as rainfall and storm surge, are projected to intensify due to increasing atmospheric moisture and sea level, and together they likely lead to more severe coastal flooding (Knutson et al., 2020; Sobel and Emanuel, 2025). In addition, a potential slowdown in TC translation speed may prolong storm residence time over land, thereby increasing rainfall accumulation and exacerbating inland flooding risk (Kossin, 2018; Feng et al., 2024). Meanwhile, overall North Atlantic hurricane frequency has also risen in the last century, especially since 1970 (Emanuel 2021). The likely drivers of this trend include reductions in aerosol pollution, internal variability, and increasing greenhouse gas emissions, however, there is currently no consensus on their relative contributions, largely due to data limitations (NOAA 2023). Projections of future TC frequency remain uncertain, with predictions showing opposite signs and large uncertainties (Knutson et al., 2020), depending on the choice of climate model, resolution, and genesis methods (Fosu et al., 2024; Knutson et al., 2020; Lee et al., 2020; Murakami and Sugi 2010). Given the changing hazard, relying solely on historical data to assess hurricane risk is increasingly inadequate.
In the (re)insurance industry, catastrophe models are essential for pricing TC risk and supporting financial instruments such as catastrophe bonds. One of the most common ways vendor catastrophe models present their outputs is through Year Event Loss Tables (YELT), also referred to as event catalogues (Jewson 2023b). A YELT typically consists of a large set of stochastic events, each assigned a simulated year and associated loss, enabling the estimation of risk metrics such as average annual loss (AAL), occurrence exceedance probabilities (OEP: the probability that the largest loss from a single event in a given year exceeds a specified amount, with return period = 1/OEP), and aggregate exceedance probabilities (AEP: the probability that the total losses from all events in a given year exceed a specified amount, with return period = 1/AEP). While these models are generally well-calibrated for loss estimation, they are typically built on static historical TC data and lack integration with evolving climate signals (Loridan and Bruneau, 2025; Pope and Phibbs, 2025). As a result, they may underestimate current and future risks, potentially leading to insufficient pricing and capital allocation, and ultimately failing to provide adequate financial protection.
Academic hazard models such as the Synthetic Tropical cyclOne geneRation Model (STORM, Bloemendaal et al., 2020; Bloemendaal et al., 2022a), Columbia HAZard model (CHAZ, Lee et al., 2018; Lee et al., 2020), the MIT model developed by Emanuel et al. (2006, 2008, and the Imperial college Storm model (IRIS, Sparks and Toumi 2024), are often designed to explore long-term, basin-scale climate trends. These models incorporate climate projections but rely on assumptions that limit their applicability for operational insurance use (Meiler et al., 2022). For example, they may simulate TC frequency using historical basin-wide averages or algorithms that require post hoc bias correction, and they often lack standardised, validated loss modules suitable for estimating financial risk under present or near-future climate conditions.
This disconnection has created a fragmented modelling landscape, where neither vendor nor academic tools fully meet the needs of risk modellers in the industry who seek actionable insights into TC risks in a changing climate. Recently, data-driven approaches have emerged, using machine learning to relate hurricane genesis, tracks, and intensity to climate drivers, for example, the Reask Unified Tropical Cyclone model (Reask UTC, Loridan and Bruneau, 2025). Also, resampling techniques to adjust vendor YELTs are widely used in industry to reflect changing event frequencies from seasonal or long-term climate signals (Jewson 2023b; Pope and Phibbs, 2025). These approaches modify the simulated loss distribution by resampling events based on adjusted frequencies, offering a fast and practical method for updating model results without rerunning full simulations. Recent advancements, such as the incremental simulation method proposed by Jewson (2023b), improve the precision of resampling by adding or removing events directly from the original YELT, rather than generating new ones independently. Pope and Phibbs (2025) apply resampling to adjust a U.S. event catalogue from present-day to a 2°C warming scenario using regional landfall rate changes from the Reask UTC model (Loridan and Bruneau, 2025), resulting in a 39% increase in AAL. These methods offer a promising way to bridge the discussed gap. Complementary efforts focused on transparency and independent benchmarking could further enhance confidence and foster broader adoption.
In this study, we introduce the Schroders Capital Insurance-Linked Securities (SCILS) model: a simple, physically grounded framework that leverages projected climate proxies (Cyclone Genesis Index, Potential Intensity) to estimate category-specific North Atlantic landfall rate changes for different global warming levels (GWL), while keeping vulnerability and exposure constant. We then apply these rate changes to resample a standard YELT, producing climate-adjusted loss distributions without rerunning full track simulations. We benchmark this resampling approach against a spatially explicit, event-based climate-conditioned YELT to highlight its strengths and limitations. SCILS quantifies shifts in losses for North Atlantic hurricanes relative to a selected historical baseline, providing a forward-looking assessment of TC hazard and enabling climate-connected risk adjustments within the basin.
2. Data and methods
2.1 Model inputs
2.1.1 Input datasets
All data for the SCILS model are extracted for the North Atlantic basin over the period 1980–2025 (46 years). We adopt 1980 as the start year to ensure a reliable and complete satellite record of TC activity and following the clear emergence of a warming trend in North Atlantic SST, in part due to aerosol effects. Historical TC tracks are obtained from the International Best Track Archive for Climate Stewardship (IBTrACS, Knapp et al., 2010), while climate variables are sourced from the ERA5 reanalysis dataset produced by the European Centre for Medium-Range Weather Forecasts (ECMWF, Hersbach et al., 2023a; Hersbach et al., 2023b). We use monthly averaged ERA5 data at 0.25° resolution, from which we extract the variables required to compute Potential Intensity (PI) and the Cyclone Genesis Index (CGI). Additionally, the Relative Oceanic Niño Index (RONI) is used to represent ENSO variability, obtained from NOAA Climate Prediction Center (CPC 2026).
2.1.2 Climate variables and projection
We use the CGI (Bruyère et al., 2012) and the PI (Bister and Emanuel, 2002; Gilford 2021) as physical proxies for tropical cyclone frequency and intensity. To estimate these variables at prescribed global warming levels (GWLs), we apply a projection procedure over the historical period. Specifically, for each variable at each grid cell, monthly average values during the hurricane season (June – November) are regressed against GWL using Theil-Sen regression (Sen 1968; Theil 1992). GWL is defined as the end point of a rolling 30-year linear regression on Global Surface Air Temperature (GSAT) from ERA5, following the definition of the Copernicus Climate Change Service (C3S) global temperature trend monitor (C3S 2026). The regression to GWL is performed separately for each month to preserve seasonality in CGI and PI. The projection to target GWL is shown in Equation 1.
For each month `m`, `V_{i,m}^{L0}` represents the original value of the climate variable (CGI or PI) at grid cell `i` and GWL `L0`. The term `\hat{V}_{i,m}^{L0}` is the value predicted by the Theil-Sen regression for that same grid cell and year. `\hat{V}_{i,m}^{L1}` is the value predicted by the regression at target GWL `L1`. Finally, `V_{i,m}^{L1}` is the resulting projected value for the target GWL `L1`, where the interannual variability is preserved but the trend has been shifted to reflect the climate state at GWL `L1`.
We projected climate variables to reflect two GWL: +1.2 ºC (near-present climate), and +2 ºC (mid-century climate). Using these projected maps of CGI and PI as inputs to the model, we derive TC activity at the specified GWL. The simple linear regression approach we use avoids potential issues with climate model biases and sidesteps downscaling or correction choices. We acknowledge the limitations of assuming a continued linear trend of PI and CGI for higher than experienced GWL. However, for near-present and near-future projections, our approach is adequate and represents a transparent, computationally, and complementary contribution to TC risk modeling.
2.1.3 Lifetime Maximum Intensity density map
To determine the position of Lifetime Maximum Intensity (LMI), we categorise observed years (1980–2025) into three ENSO states (El Niño, Neutral or La Niña) based on the RONI index (CPC 2026), averaged over the peak hurricane season (August–October, ASO). For each ENSO state, we then construct kernel density estimate maps of historical LMI locations using IBTrACS data.
2.1.4 Historical distribution of LMI/PI ratio
To capture how actual storm intensities compare to their theoretical maximum, we quantify the empirical ratio of each TC’s LMI to the corresponding PI. Figure 1a shows the relative frequency distribution of this LMI/PI ratio from historical IBTrACS data (1980–2025) above tropical storm strength. We found no material dependence of LMI/PI on climate metrics such as ENSO state (Spearman rank correlation -0.087, p=0.041) or Main Development Region (MDR) SST (Spearman rank correlation 0.018, p=0.68). There is some dependence of LMI/PI on PI, with PI > 64 m/s showing a higher likelihood of LMI/PI < 0.4, however, conditioning the LMI/PI sampling on PI did not improve the final landfall distributions. Thus, we sample directly from the historical LMI/PI distribution in SCILS, without further conditioning. This approach is similar to Sparks and Toumi (2024) and Emanuel (2003, 2005), both applying no conditioning on the LMI/PI distribution.
2.1.5 Regional probability distributions of landfall intensity and LMI
: To translate a storm’s LMI into its expected landfall intensity (LFI) – which depends on how far it travels over water and the conditions along the way (Jewson 2023a; Wang and Toumi, 2022) – we derive separate empirical distributions of LFI/LMI for four North Atlantic regions. Following the regional boundaries proposed by Jewson (2023a), we pool IBTrACS data (1980-2025) above tropical storm strength in each region and fit a zero-one inflated Beta distribution to LFI/LMI (Figure 1b). The non-landfalling storms are explicitly represented by the zero-mass parameter p0, while storms with LFI = LMI are captured by the one-mass parameter p1. The SCILS model then samples an LFI/LMI ratio from the region-specific distribution corresponding to each storm’s LMI location. The fitted parameter ranges for the four regions are non-overlapping (Table S1), supporting the use of the four regions defined by Jewson (2023a). Sampling LFI/LMI ratio from historical regional distribution assumes a constant fraction of storms making landfall with respect to GWL. Although physical mechanisms such as coastward versus poleward migration of LMI could alter landfall frequency, these influences may offset one another, and their net magnitude remains unclear (Kossin et al., 2014; Wang and Toumi 2021). Given these uncertainties and the absence of a detectable historical trend (Vecchi et al., 2021), we consider the stationarity assumption appropriate.
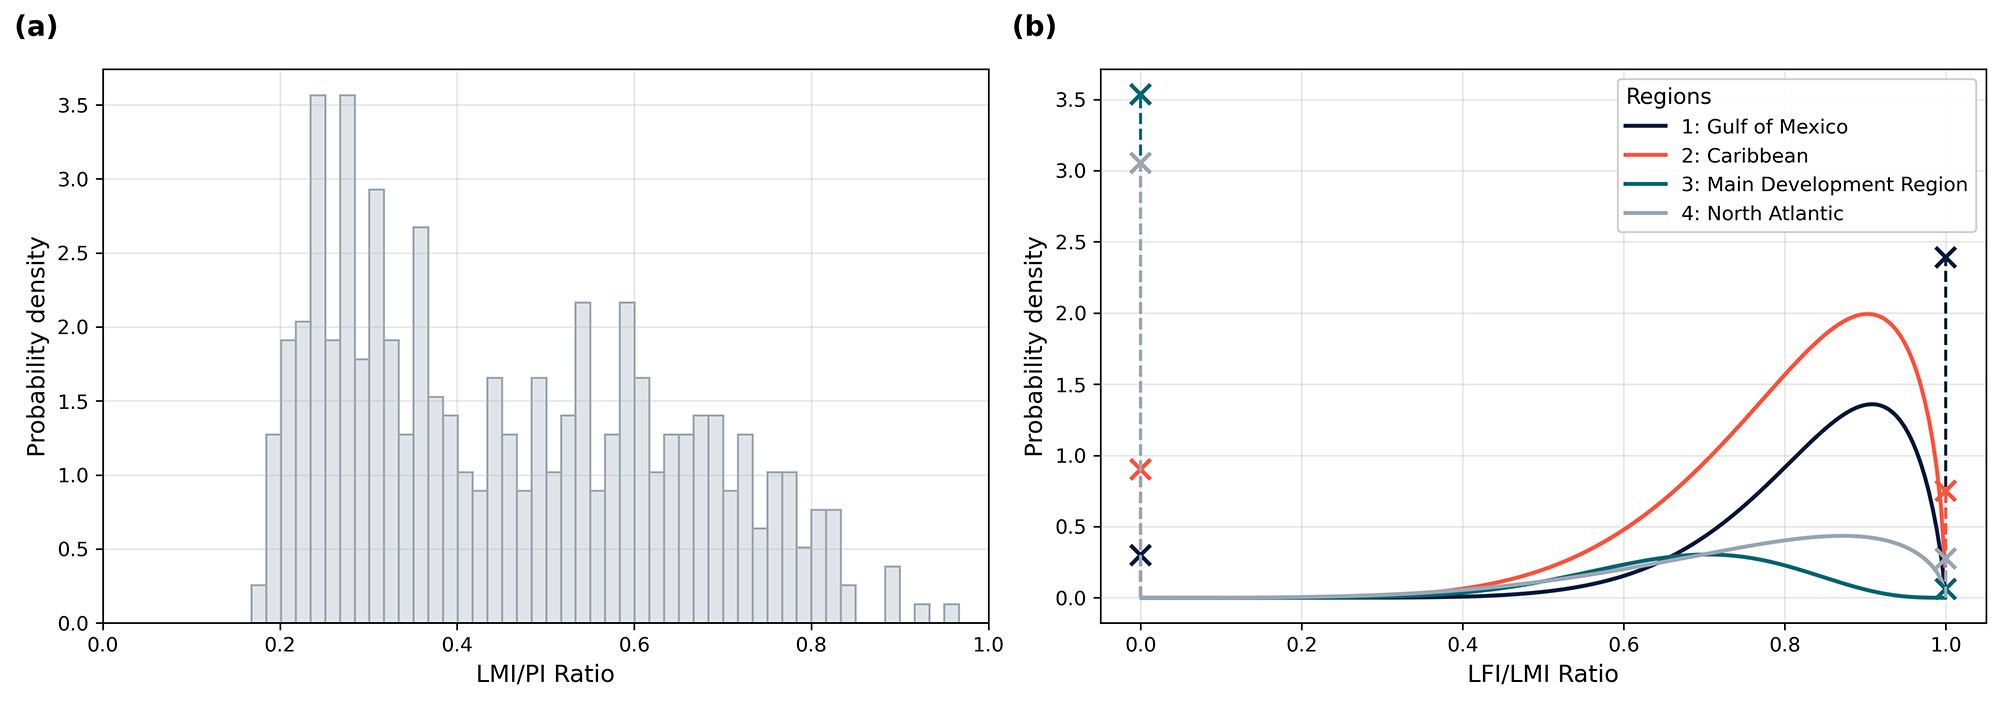
Figure 1: (a) Relative frequency distribution of the ratio between Lifetime Maximum Intensity (LMI) and Potential Intensity (PI), based on historical observations from IBTrACS (1980–2025). (b) Regional zero-one inflated Beta distributions of the ratio between Landfall Intensity (LFI) and LMI, based on IBTrACS data (1980–2025) with regions defined following Jewson (2023a).
2.2 Model flowchart
The SCILS model uses climate reanalysis data (ERA5) and historical tracks (IBTrACS) as inputs and is based on physical proxies for TC frequency and intensity. As shown in the model flowchart (Figure 2), the model consists of four steps:
- Tropical cyclone numbers: We estimate both seasonal and monthly TC counts using projected monthly CGI maps. For each year, the total number of TCs is drawn from a Poisson distribution whose rate parameter equals the CGI summed over the main development region (MDR; 10°–20°N, 60°–15°W) during the hurricane season (June–November), scaled by a calibration constant. The seasonal TC number is then distributed to months by drawing from a multinomial distribution using monthly MDR CGI as weight. The use of CGI over the MDR is in line with Bruyere et al. (2012), who showed that genesis potential indices computed over the MDR show higher skill in representing basin-wide cyclone frequency than indices averaged across the entire basin. We find that the seasonal summed MDR CGI is strongly correlated (Spearman correlation 0.72) with historical basin-wide TC frequency.
- Tropical cyclone locations: The LMI location for each event is drawn from historical LMI location density maps, conditioned on ENSO states (El Niño, Neutral or La Niña). For each stochastic year, the ENSO state is assigned based on the RONI-derived ENSO state of its corresponding historical year.
- Tropical cyclone Lifetime Maximum Intensity: We look up PI values at the LMI location from the projected monthly PI maps, and sample from the historical LMI/PI distribution. Then, the LMI of the storm is calculated by multiplying PI with the LMI/PI ratio. If PI or LMI are below tropical storm strength, we reject the sample and resample by drawing a new LMI location and LMI/PI value. This ensures consistency with the empirical distributions, which were all conditioned on TCs with tropical storm strength or above.
- Tropical cyclone landfall intensity: Lastly, we calculate the landfall intensity by multiplying LMI with a LFI/LMI ratio sampled from the regional zero-one inflated Beta distribution, where the region is determined by the LMI location using the region definitions of Jewson (2023a).
In summary, the SCILS model generates stochastic event sets that include the number of TCs per month and year, the LMI and corresponding locations of each event, and the landfall intensity. These event sets are produced for targeted GWLs. In this work, we conduct simulations at 1.2° and 2.0°C GWL (for constant vulnerability and exposure, see section 2.1). We also run a historical scenario using historical climate (1980–2025) as inputs. The historical scenario serves both as a baseline and to evaluate model performance through comparison with observed historical records. We run 1,000 model realisations for each historical year (46,000 years total) and each warming level.
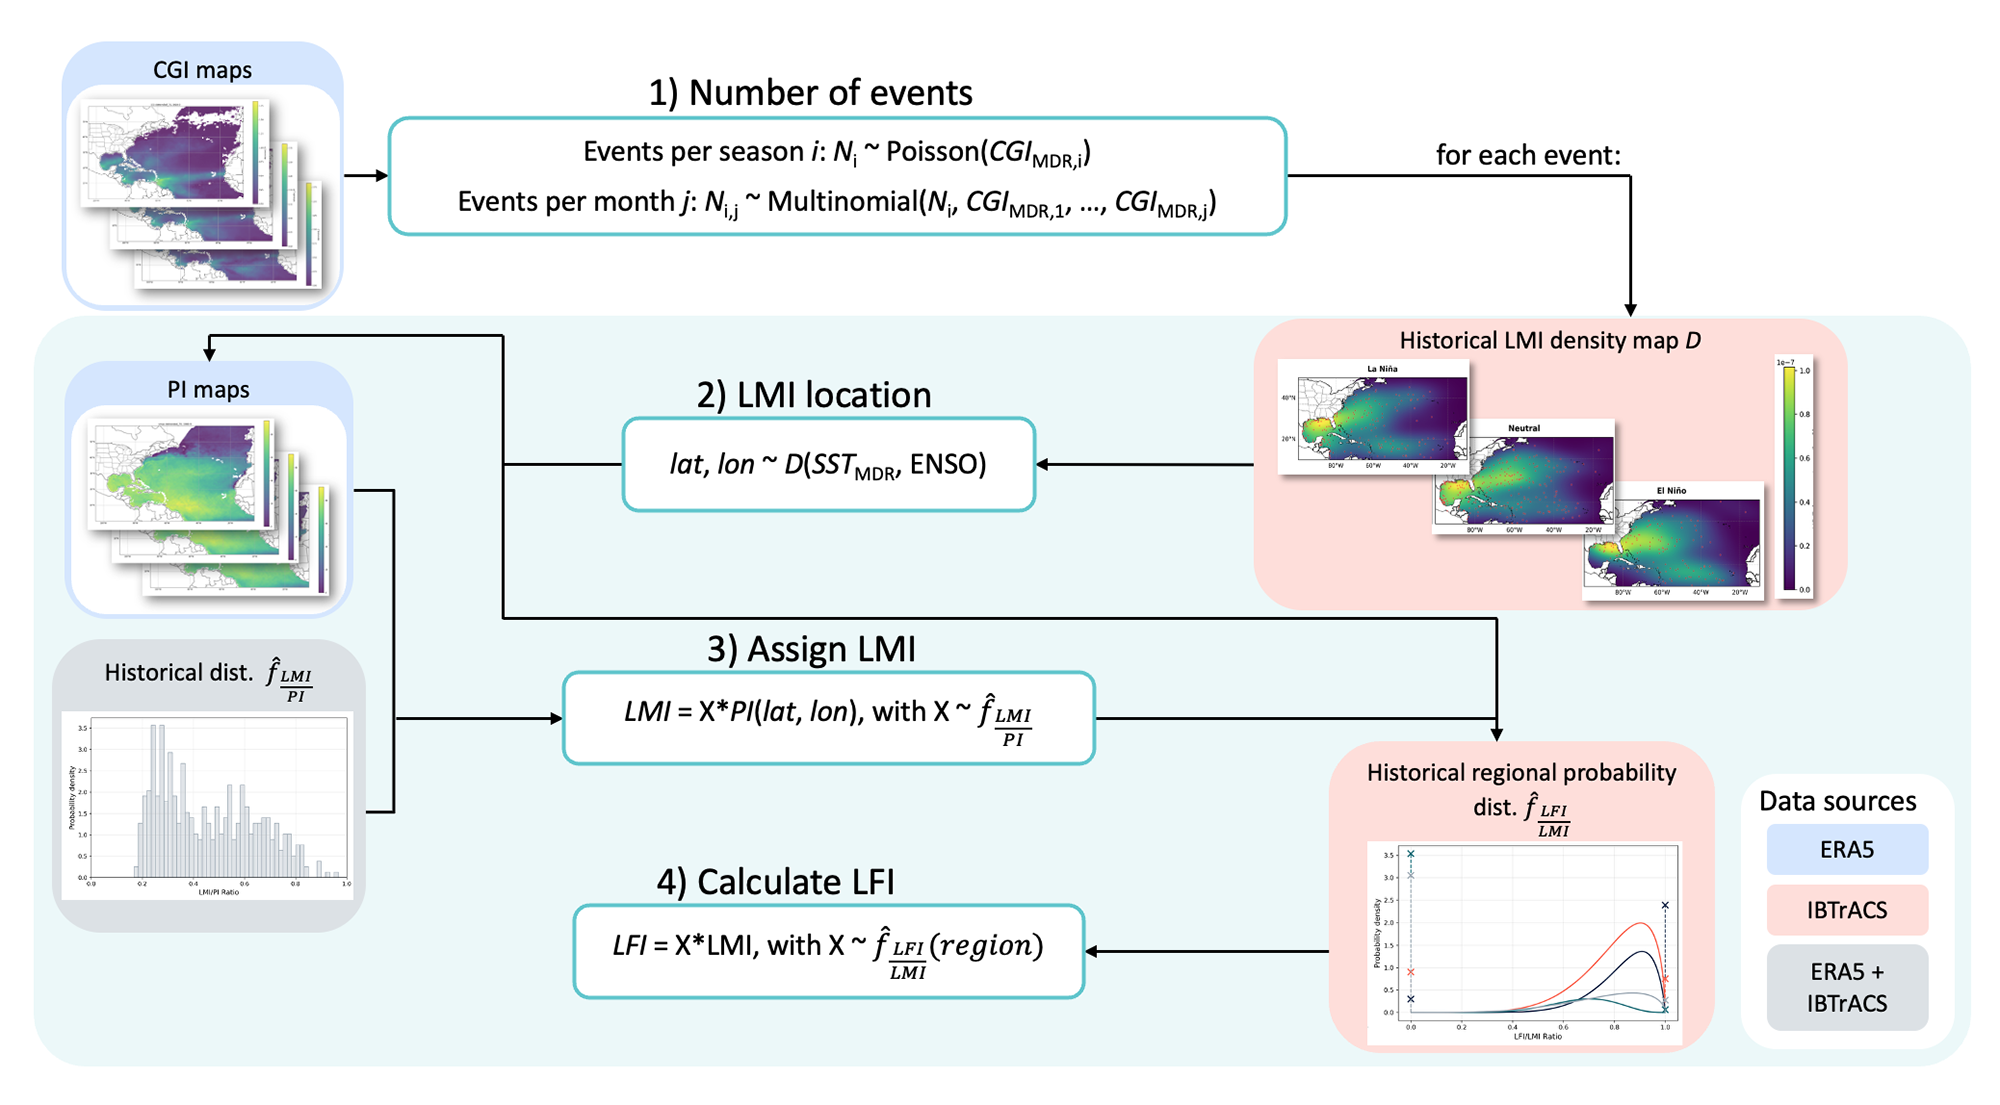
Figure 2: Structure of the SCILS model. The SCILS model uses input data from ERA5 (blue), IBTrACS (red), and their combination (grey). The model proceeds in four steps: (1) Number of events: Seasonal TC counts are drawn from a Poisson distribution, with rate parameter equals to the seasonal Cyclone Genesis Index (CGI) summed over the Main Development Region (MDR), then distributed to months using monthly MDR CGI as weights for a Multinomial. (2) LMI location: Lifetime Maximum Intensity (LMI) locations are sampled from historical density maps, conditioned on ENSO phase. (3) Assign LMI: LMI of each event is calculated by multiplying Potential Intensity (PI) at the LMI location with a historical LMI/PI ratio drawn with replacement. (4) Calculate LFI: Landfall Intensity (LFI) is computed by multiplying LMI with a regional LFI/LMI ratio drawn with replacement.
2.3 Year Event Loss Table (YELT)
2.3.1 Creating the YELT
To demonstrate how the SCILS model can be used to adjust event catalogues from vendor models, we generate a historical Year Event Loss Table (YELT) for the North Atlantic basin using the open-source risk assessment model CLIMADA (Aznar-Siguan and Bresch, 2019). CLIMADA estimates impacts based on three components: hazard, exposure, and vulnerability. For the hazard component, we use the STORM present-day track set (10,000 years) representing the 1980–2018 climate (Bloemendaal et al., 2020) and calculate the 2D-wind field using the parametric wind model from Holland (2008). Exposure of physical assets is modelled using LitPop (Eberenz et al., 2020), while vulnerability is represented by the regional impact functions from Eberenz et al. (2021). Direct economic damages are computed at a spatial resolution of 300 arc-seconds (~10 km).
2.3.2 YELT adjustment by resampling
We use the average landfall rate changes per Saffir-Simpson Hurricane Wind Scale category from the SCILS model to resample the YELT for the North Atlantic basin by incremental simulation (i.e., thinning events in categories with reduced rates and duplicating events in categories with increased rates; Jewson 2023b). We adjust the YELT from historical (1980–2025) to both 1.2°C and 2.0°C GWL. To compare the SCILS model with literature under future climate conditions, we also adjust the historical YELT using average landfall rate changes from STORM present and future tracks (Bloemendaal et al., 2020, 2022a), and average landfall rate changes from Knutson et al. (2020), which summarised multiple model predictions under 2°C GWL. For the latter, the landfall rate change per category was derived by Jewson (2023a), called Knutson et al. (2020) hereinafter. For each adjustment, we create 100 realisations of the adjusted YELT, with the same size as the historical YELT. It is important to note that in the resampling method, we only change the frequency of events, while other components of risk such as exposure and loss per event are held constant.
There are considerable uncertainties in future TC risk (Meiler et al., 2025). The three modelling approaches of future TC risks used in this study represent a ~2 °C GWL: the STORM future tracks are based on a very high greenhouse gas emissions scenario, specifically SSP5-8.5, covering the period 2015–2050 (Bloemendaal et al., 2022a). According to the IPCC AR6 report, the associated global warming level (GWL) ranges from a best estimate of 1.6 °C for the 2021–2040 period to 2.4 °C for 2041–2060 (IPCC 2023). Knutson et al. (2020) rescaled projections from earlier studies to align with a 2 °C increase in GSAT. The SCILS model extrapolates observed (linear) trends in physical proxies from the period 1980–2025 with GWL as predictor. The model can directly extrapolate to +2° GWL, which – assuming a continued linear warming trend – results in the year 2057, in line with SSP2-4.5.
Benchmarking against a spatially explicit simulation
To assess the limitations of resampling for climate-adjusted risk estimation, we compare YELTs resampled using STORM landfall rate changes with a fully simulated, spatially explicit future YELT. The spatially explicit YELT incorporates both frequency shifts and spatial/intensity changes. It was generated with CLIMADA using the STORM future-climate track set (2015–2050; SSP5-8.5). This track set comprises 10,000 years of simulated TC tracks for four climate models: CMCC-CM2-VHR4, CNRM-CM6-1-HR, EC-Earth3P-HR, and HAdGEM3-GC31-HM (Bloemendaal et al., 2022a). Consistent with the historical YELT, we apply the same 2-D wind field model (Holland 2008), exposure data (LitPop; Eberenz et al., 2020) and vulnerability functions (Eberenz et al., 2021). We then compare the loss distribution of the resampled and spatially explicit YELTs. This benchmark highlights where resampling under- or over-estimates risk and how spatial track variations influence loss patterns.
3. Results
3.1 Historical model performance
To evaluate how well the SCILS model captures observed TC landfall characteristics, we first compare historic model simulations (model forced with historical climate inputs, see section 2.2) against observations from 1980 to 2025. Here, we define tropical storms as systems with sustained winds ≥ 17.5 m s-1, hurricanes as those with sustained winds ≥ 33 m s-1, and major hurricanes (category 3–5) as those with sustained winds ≥ 50 m s-1. The simulated annual landfall counts show reasonable agreement with observations across all intensity groups (Figure 3).
Quantitative evaluation using Root Mean Square Error (RMSE) and Continuous Ranked Probability Score (CRPS) highlights both strengths and limitations (Table 1). The RMSE measures the accuracy of the simulation mean compared to observations. The null model to compare to is the historical data itself, i.e., the standard deviation of the observed counts. The relative improvement of RMSE over the null model increases with increasing intensity threshold. A lower performance for tropical storm strength systems might be an effect of the lower intensity limit applied to the LMI/PI and LFI/LMI distributions. However, for major hurricanes, which cause most of the insured losses, the SCILS model clearly outperforms the null model (11% lower RMSE). CRPS shows full distribution accuracy, calibration, and sharpness of the model simulations. Here, we chose a negative binomial distribution with static parameters (i.e., not conditioned on GWL) fitted for each intensity threshold as the null model. As for RMSE, relative model outperformance also increases with increasing intensity threshold and reaches 13% lower CRPS for major hurricanes (Table 1). A large majority of observed annual landfall counts falls within the 95% percentile range of the simulations, confirming a well calibrated model (Table 1). The apparent overconfidence for major hurricanes is a statistical effect of the non-negative counts. The SCILS model 95% prediction interval coverage is comparable to the null model (same negative binomial as for CRPS). There are some very active seasons including 2020, which seem to be not well captured by the model. Potential reasons for the underestimation include limitations of the physical proxies in reproducing the thermodynamic variability, or that dynamic effects along TC tracks are not captured by the model (see section 4 for more detailed discussion on model limitations). However, for a sample size of 46 years, one would expect roughly one year to be above the 97.5th percentile. Given the 2-3 observations we see above that level (depending on the intensity threshold) and the limited amount of data, the mismatch could also come from sampling noise.
In summary, the SCILS model reproduces the mean behaviour and general year-to-year fluctuations in TC landfalls, making the model adequate for climate-scale attribution (i.e., quantifying how changes in climate drivers like SST trends and ENSO variability have altered seasonal landfall risk) and scenario-based risk analysis.
| Intensity threshold | RMSE | CRPS | 95% PI* coverage | |||
|---|---|---|---|---|---|---|
| Null1 | SCILS | Null2 | SCILS | Null2 | SCILS | |
| TS+ | 3.32 | 3.11 | 1.84 | 1.72 | 95.7 | 93.5 |
| Hurricanes (Cat1+) | 2.30 | 2.09 | 1.25 | 1.13 | 97.8 | 93.5 |
| Major hurricanes (Cat3+) | 1.19 | 1.05 | 0.61 | 0.53 | 97.8 | 100.0 |
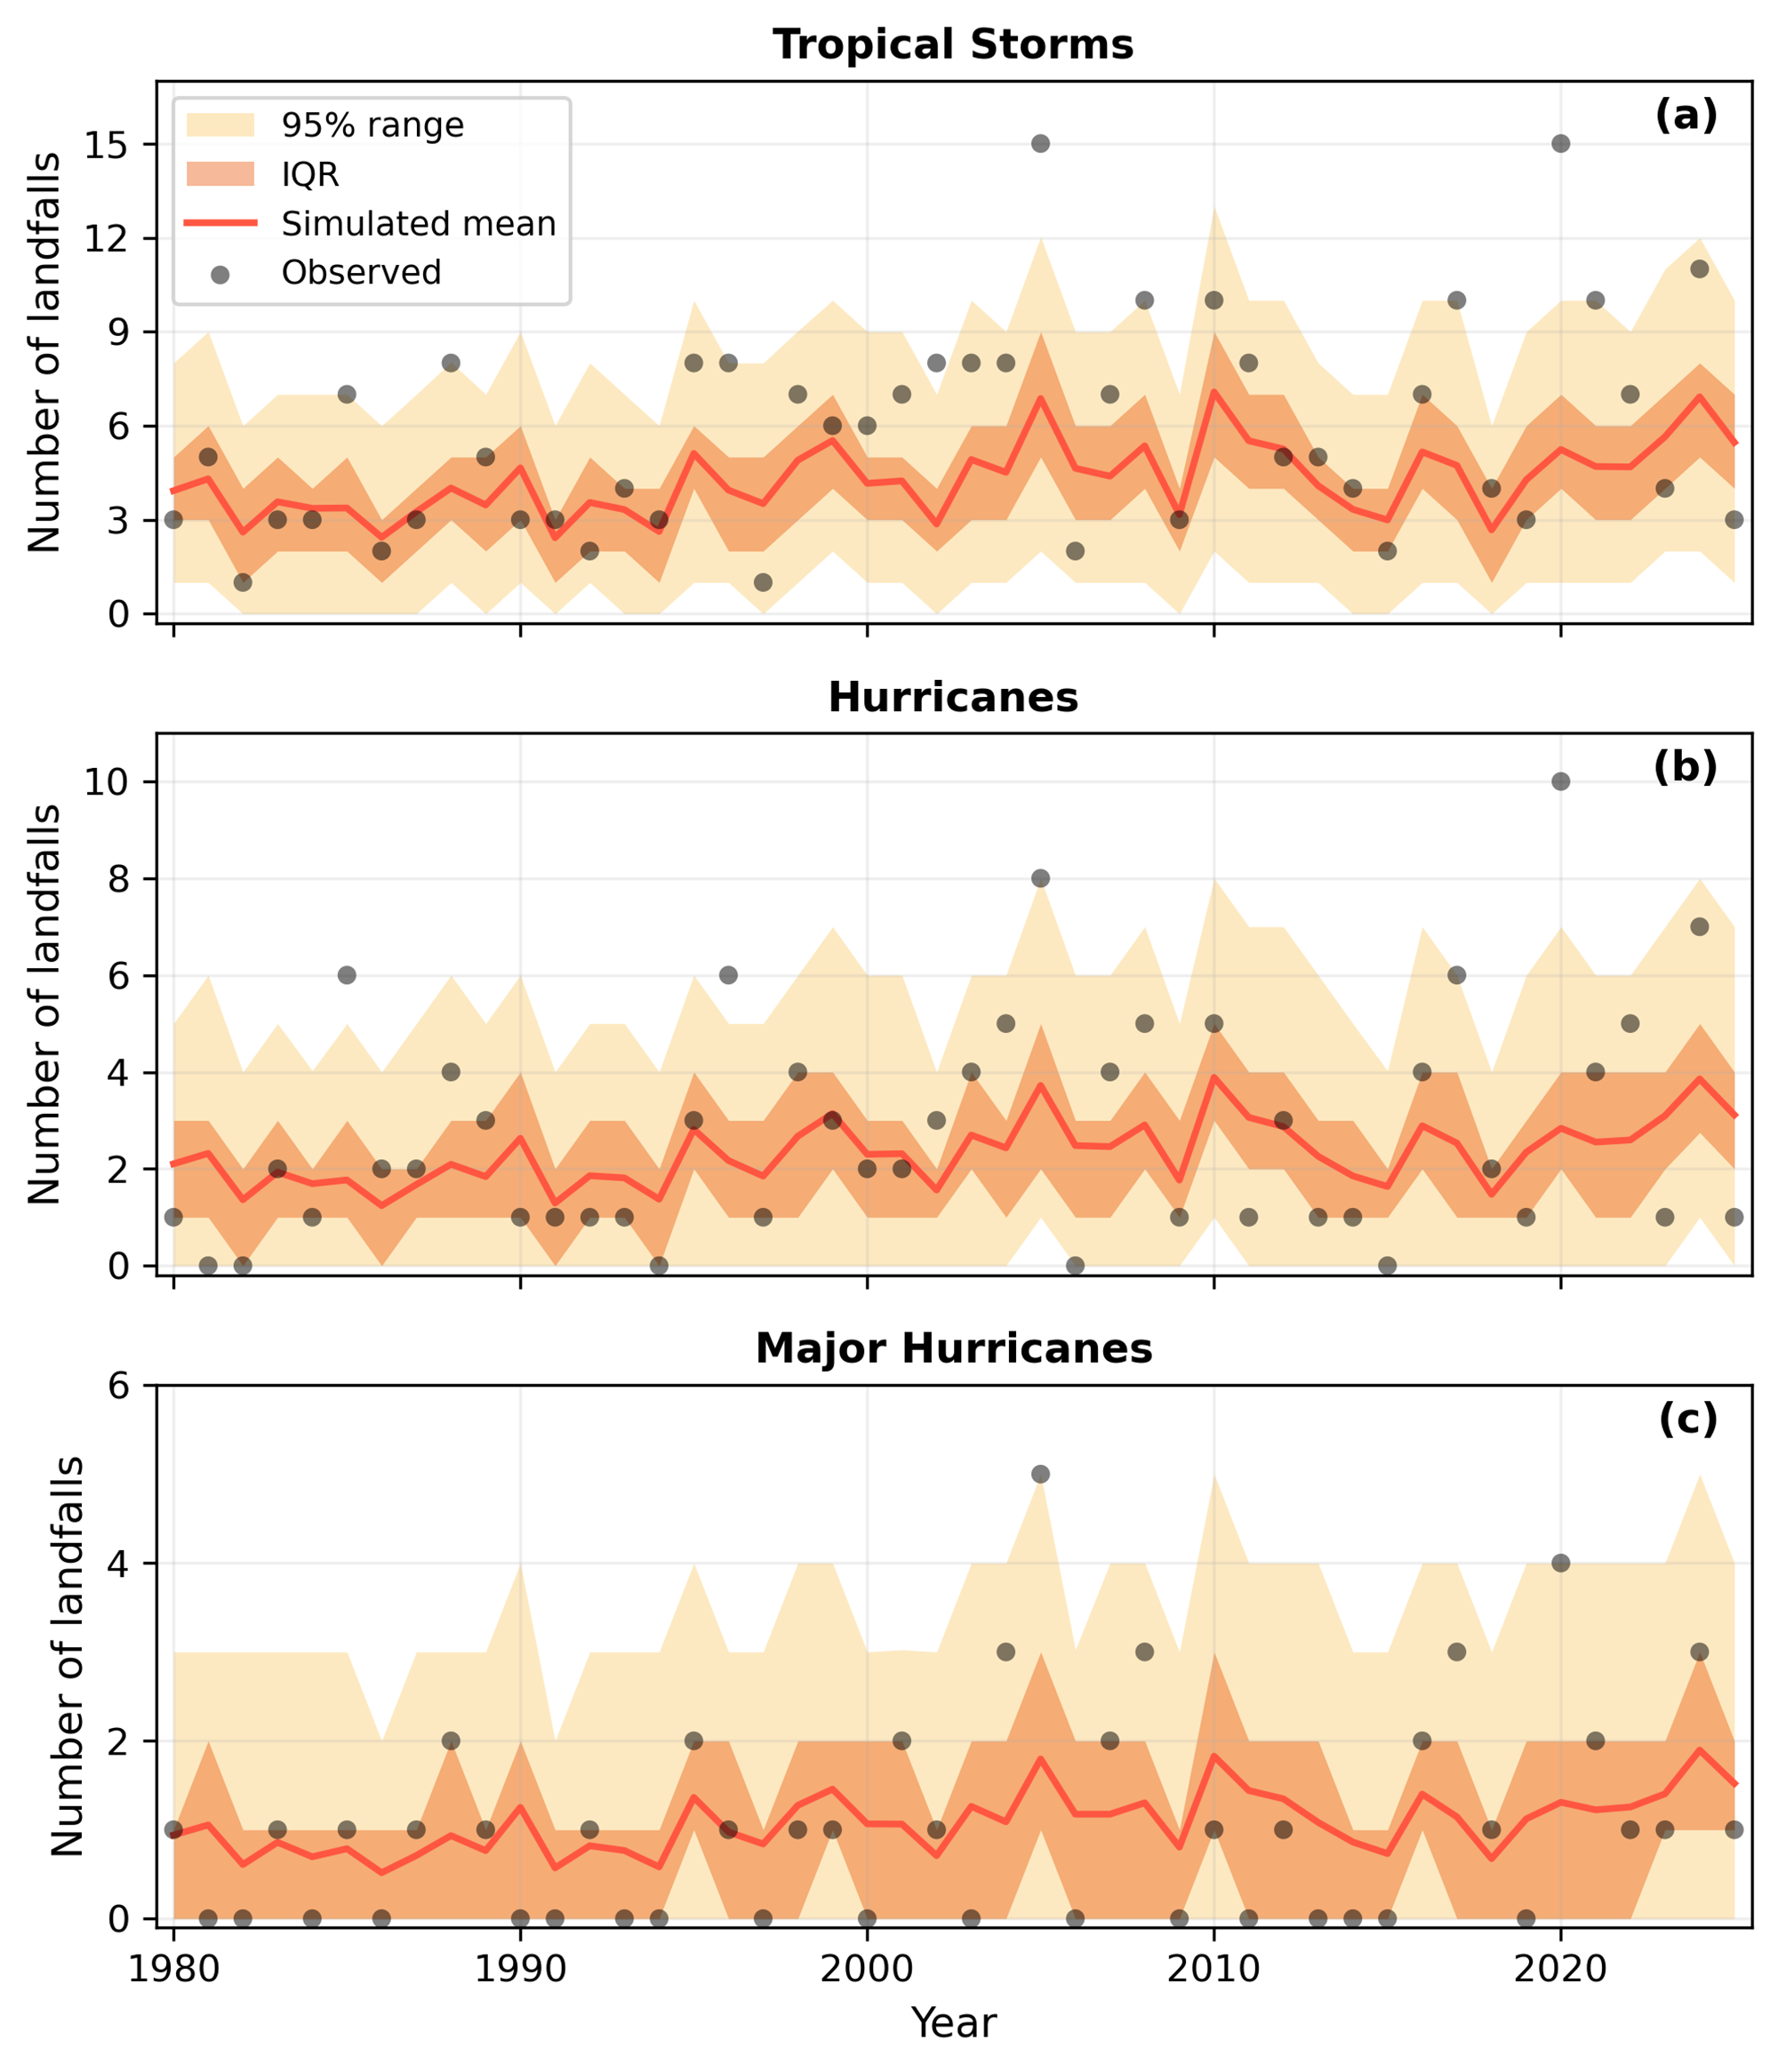
Figure 3: Time series of number of (a) landfalling tropical storms (category 0-5), (b) hurricanes (category 1-5), and (c) major hurricanes (category 3-5) in IBTrACS and model simulations. The dark orange curve shows the mean of the 1,000 model simulations. Black dots denote IBTrACS data. The orange shaded area represents the interquartile range (25th–75th percentiles), while the yellow shaded area indicates the 95% range (2.5th–97.5th percentiles) across the simulations.
3.2 Adjusted view of current risks: landfall and loss changes
To assess how TC hazard changed from the historical to the near-present climate, we compare landfall frequencies by hurricane category between stochastic event sets generated by the SCILS model with historical and near-present (+1.2°C; see section 2.2) climate inputs. The analysis shows a 13–15% increase in category 0–3 landfall events, and a substantially larger increase in higher-intensity storms: category 4 events increase by 20%, and category 5 events by 22% (Figure 4a: SCILS 2020). The larger relative increase in landfall frequency of category 4 and 5 TCs is especially important for risk assessment, because high-category TCs cause the most damage and economic losses in the North Atlantic basin (Knutson et al., 2020).
Figure 4b shows the relative change in the YELT loss distribution, adjusted using the SCILS-simulated landfall ratio, comparing historical to near-present climate (labelled SCILS 1.2°C). The adjusted YELT indicates a 15% increase in AAL. Loss ratios for OEPs decline with increasing return period, indicating that most of the increase in loss is concentrated in more frequent, lower-severity events. Specifically, losses increase by 31% for the 2-year return periods, 14% for 5-year-return periods, 11% for the 10-year return period, and gradually decrease to 5% for the 100-year return period. In the tail, i.e., return periods larger than 200 years, the loss increases are smaller with approximately 2% for 200-year and 3% for 500-year return period, respectively.
The results from adjusting the YELT by resampling suggest that while overall losses have increased under near-present climate conditions, the most substantial changes are observed in frequent events, with a sizable change for medium events and more modest increases for rare, high-impact events. Frequent events typically affect the insurance retention layer (i.e. losses that primary insurers cover before ceding risk), medium events correspond to the reinsurance layer (i.e. losses ceded to reinsurers above the retention layer), and rare, high-impact events relate to solvency (i.e. events used to calibrate an insurer’s capital reserves). However, it is important to recognise a key limitation of the resampling method used in this adjustment: it modifies only the frequency of existing events in YELT, without introducing new events or altering the severity (loss) of original ones. As a result, losses at higher return periods are effectively “capped” by the largest events present in the original YELT. This limits the ability of the method to fully capture potential increases in tail risk and to anticipate additional grey swan events under a changing climate. Consequently, loss adjustments at higher return periods (>100 years) are likely underestimated.
3.3 Predicting future risks: landfall and loss changes
To understand how TC hazard and loss may change under future climate conditions, we compare stochastic event sets from the SCILS model forced with historical climate and +2°C GWL (~mid-century). The resulting landfall ratios are shown in Figure 4a (labelled SCILS 2°C). We further compare the future projection from our model with the landfall ratio from the STORM model (comparing future and present track sets), and the literature range for 2°C warming, as reported by Knutson et al. (2020). For the latter, category-level landfall ratios were estimated by Jewson (2023a; see section 2.3). The distributions depicted in Figure 4a reflect different sources of uncertainty. All three projections include sampling uncertainty from bootstrapping and internal variability from stochastic elements within each modelling framework. STORM additionally incorporates climate model uncertainty, as its synthetic tracks are generated using four GCMs under a common emission pathway (see section 2.3). Knutson et al. (2020) summarise projections across multiple modelling approaches and climate models, with results scaled to 2°C GWL, thereby additionally reflecting uncertainty from different climate models and modelling frameworks. As a result, SCILS show the narrowest spread, STORM shows multi-peak distribution at each category, from the four GCMs, and Knutson et al. (2020) presents the widest range, from the aggregation across models. Both SCILS 2°C and STORM projections fall within the range of Knutson et al. (2020), while SCILS 2°C tends to lie at the higher end. To better understand how intensity and frequency changes contribute to the estimate, we analyse the model sensitivity to each of these drivers in section 3.4.
All three future projections predict the highest increase for category 5 landfalls, but to different degrees (average in SCILS 2°C: +72%, STORM: +37%, Knutson et al. (2020): + 27%). Both STORM and Knutson et al. (2020) suggest a decrease in tropical storm landfalls (category 0, average in STORM: -13%, Knutson et al. (2020): -11%), accompanied by increases in higher categories. In contrast, SCILS 2°C projects increases across all categories, with landfall frequencies rising by 34% for tropical storms. Among the four GCMs used to generate the future STORM tracks, HAdGEM3-GC31-HM and CMCC-CM2-VHR4 project the highest number of landfalls across all storm categories. Specifically, CMCC-CM2-VHR4 predicts the highest average landfall ratios for categories 0–3, while HAdGEM3-GC31-HM leads for categories 4–5. In contrast, EC-Earth3P-HR projects the lowest landfall ratios for categories 0–3, and CNRM-CM6-1-HR shows the lowest ratios for categories 4–5.
Figure 4b shows the projected change in losses over different return periods between the adjusted future YELT and the historical YELT, based on landfall ratios from the three sources (SCILS 2°C, STORM, and Knutson et al. (2020)). We use the mean landfall ratio at each category for resampling, so the distribution range shown in Figure 4b reflects only sampling uncertainty from the resampling process, while other uncertainties included in the landfall ratios are not propagated. Among the three adjustments, Knutson et al. (2020) projects the smallest increase in AAL, at +10%, while the SCILS model projects the largest, at +44%. STORM falls in between with +17%, same as the SCILS estimate for near-present climate (SCILS 1.2°C). Across all return periods, SCILS 2°C consistently shows the highest increase in OEP loss, followed by STORM, with Knutson et al. (2020) producing the lowest estimates. As with the near-present climate adjustment, OEP loss ratios decrease with increasing return period across all three models, and differences between the three future adjustments converge at higher return periods. For SCILS 2°C, the loss ratio is highest for the 2-year return period (+89%), gradually declining to +6% for the 500-year return period. STORM shows a similar pattern, with a +35% increase for the 2-year return period, tapering to +3% for the 500-year return period. Knutson et al. (2020) exhibits the smallest changes, ranging from +17% at the 2-year return period to +3% for the 500-year return period.
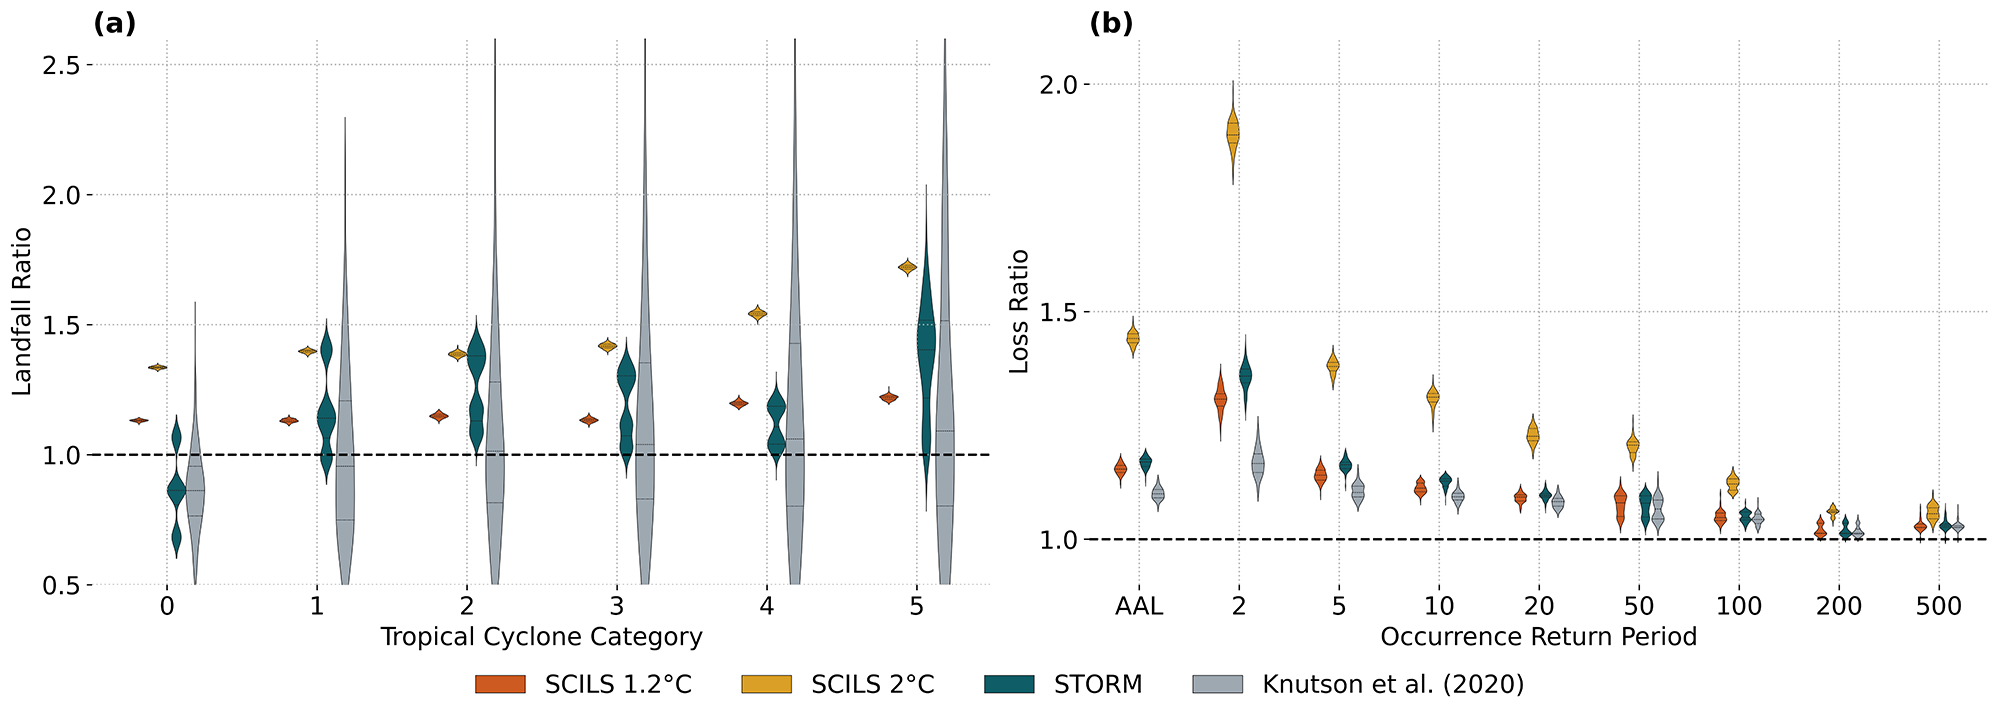
Figure 4: (a) Ratio of landfalling events by TC category for stochastic event sets generated by the SCILS model under historical climate compared with near-present climate (SCILS 1.2°C) and with future climate (SCILS 2°C), as well as for the STORM present and future track sets (STORM) and ratios from Knutson et al. (2020). Landfall ratios are calculated using bootstrap with replacement (n equal to the original sample size), repeated 300 times for each model. (b) Ratio of average annual loss (AAL) and losses at given occurrence return periods (1/occurrence exceedance probability; OEP) between YELTs adjusted by the corresponding landfall ratios and the original historical YELT. The distributions show the spread across 100 resampled YELTs for each adjustment.
In addition to differences in model configurations, discrepancies among model projections also arise from variations in the historical baseline periods (SCILS: 1980–2025; STORM: 1980–2018; Knutson et al. (2020): multi-model aggregation with varying baselines) and definitions of future climate conditions (SCILS and Knutson et al. (2020): +2 °C warming; STORM: 2015–2050 period for SSP5-8.5,), as described in Section 2.3. The comparison of future projections by the three models indicates that while all models suggest future increases in TC-related losses, especially for frequent events, the magnitude of projected change varies significantly depending on the model used, with the SCILS model suggesting the highest sensitivity of landfall changes to climate.
3.4 Model sensitivity to frequency and intensity
To better understand what is driving the projected changes in the SCILS model, we assess the sensitivity of the model to frequency and intensity changes by comparing the full SCILS model with two partial models: i) an intensity-only model, where we only change the PI (intensity proxy) to 2°C level, while keeping CGI (frequency proxy) at historical level, and ii) a frequency-only model, which does the reverse.
The resulting landfall ratios across storm categories are shown in Figure 5a. The intensity-only model shows a decrease in landfall for tropical storms (-6%) and category 1–2 TCs (-1% and 2%), a negligible increase of category 3 (+0.1%), and a more pronounced change of category 4–5 storms, showing 12% and 25% increase respectively. This trend of decreasing tropical storms and increase of category 4–5 TCs is more in line with the narrative from Knutson et al. (2020) than the full SCILS model. In contrast, the frequency-only model projects a consistent increase in landfall frequency across all categories, ranging from 36% to 45%. The intensity-only and frequency-only models show a multiplicative effect in the full model: the landfall ratio for each category in the full simulation is approximately the product of the ratios from the two partial models.
For loss ratios, the frequency-only model results in a significantly larger increase in AAL than the intensity-only model (+40% versus +3%; Figure 5b). The loss ratio from Knutson et al. (2020) adjustment falls between the frequency-only and intensity-only results, with the intensity-only model showing closer agreement with the Knutson et al. (2020) estimates. The substantially stronger loss increase from the frequency-only model emphasises the importance of understanding frequency changes in future TC risk assessments.
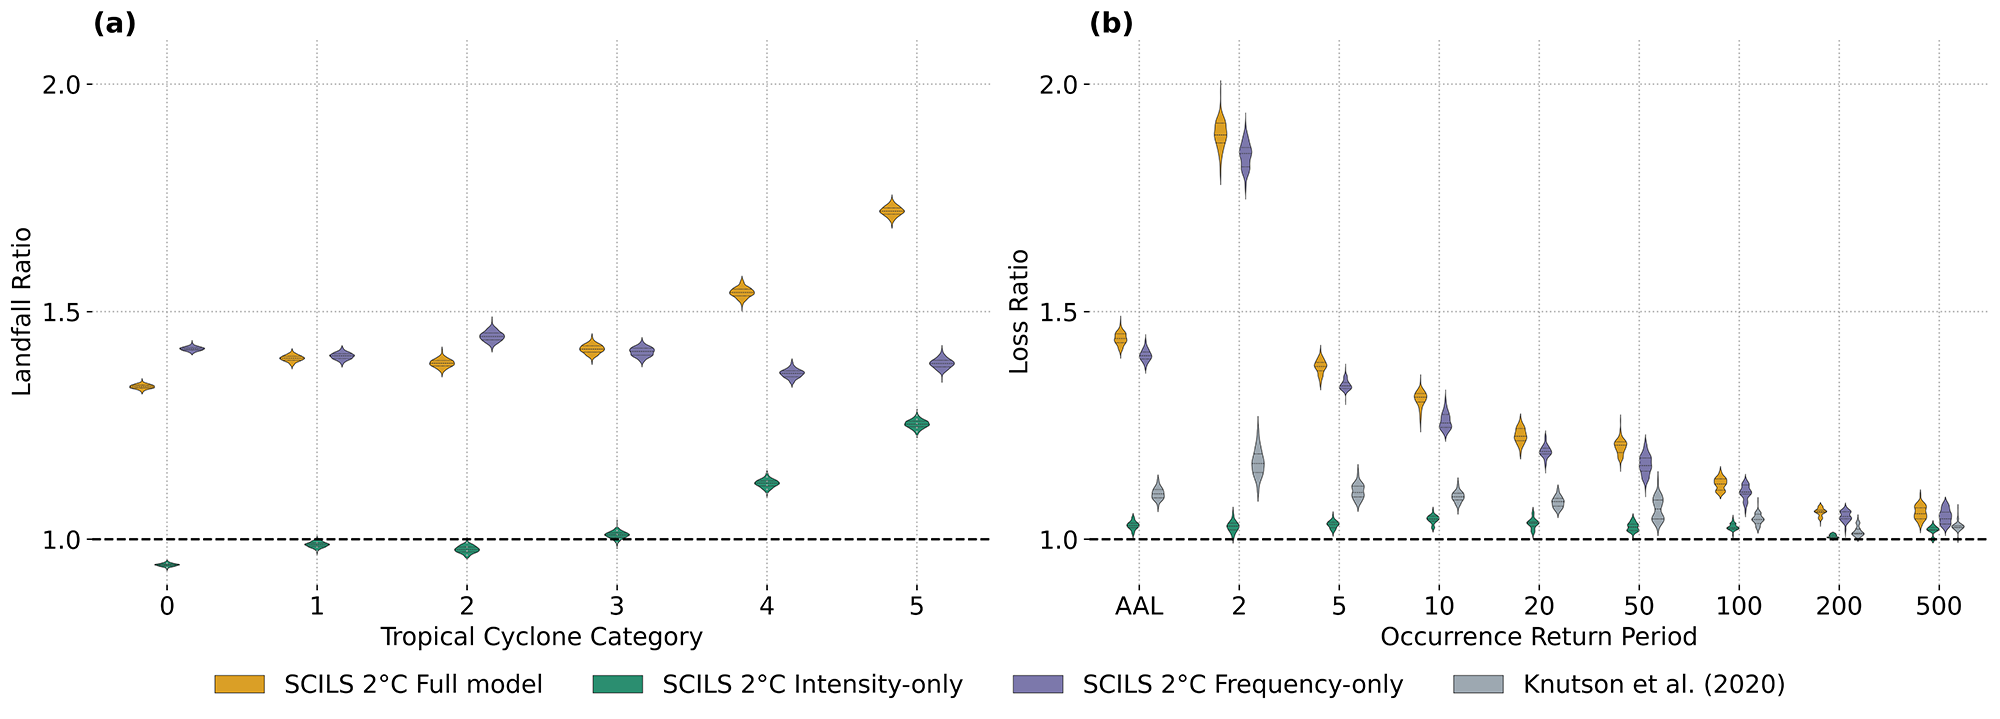
Figure 5: (a) Ratio of landfalling events by TC category for the SCILS historical stochastic event set compared with event sets generated by the SCILS full model, SCILS intensity-only model, and SCILS frequency-only model under future climate (+2°C). Landfall ratios are calculated using 300 bootstrap samples for each model. (b) Ratio of average annual loss (AAL) and losses at given occurrence return periods (1/occurrence exceedance probability; OEP) between YELTs adjusted by the corresponding landfall ratios and the original historical YELT. Loss ratios from Knutson et al. (2020) in Figure 4 are also shown for comparison.
3.5 Comparing resampled with spatially explicitly calculated future impact
As discussed in section 3.2, the resampling method is limited in its ability to predict loss at high return periods. To better understand the limitations of the resampling method, we compare the loss estimates from the resampled future YELT with the spatially explicit future YELT derived from STORM tracks for a future climate in CLIMADA (see section 2.3). Given that both CLIMADA calculated YELTs (historical YELT and future spatial explicit YELT) use the same exposure and vulnerability components, we are only comparing the hazard component. Notably, the number of events per category is nearly identical, since the resampled YELT scales the historical event set using landfall ratios per category derived from the STORM track set.
For the spatially explicit future YELT, the loss ratio of OEP increases with increasing return period, while for the resampled YELT, the loss ratio decreases with increasing return period (Figure 6a). Also, the increase of AAL is lower for the spatial explicit YELT (+11.4%) than for the resampled YELT (+17%). The loss ratios are comparable for the 10–50 year return period, with the resampled YELT having greater losses at return periods <10 years, and the spatial YELT having greater losses at return periods >50 years. The AEP loss ratios show a similar picture (see Figure S1 in Supplementary material). The lower losses at high return periods (>50 years) confirm our assumption in section 3.2 that resampling underestimates tail risk.
To better understand what contributes to the difference between the two YELTs, we compare the average event loss by category (Figure 6b). For category 0–1 TCs, the average loss per event is similar in both YELTs, at around US$1 billion and US$8 billion, respectively. For category 2 TCs, the spatial YELT shows a lower event loss (US$23 billion) compared to the average in the resampled YELT (US$25 billion). In contrast, for major hurricanes (category 3–5), the spatial YELT yields higher losses per event, with the most notable difference in category 5, with US$83 billion in the spatial YELT versus US$76 billion in the resampled YELT.
We discuss two potential reasons for the lower average per event loss for category 2 and the higher per event losses for category 4-5 landfalls in the spatial YELT. First, there could be a change in storm size (Rmax) in STORM from present to future tracks, with smaller category 2 TCs and larger major hurricanes in the future track set. However, Bloemendaal et al. (2022a) sample Rmax from the same distribution (Figure S3a) in their model as changes in size cannot be reliably derived from the coarse-resolution climate models they employed. However, the resulting Rmax distribution per category is slightly skewed towards larger storms, especially for category 3 and 4, while category 2 shows no change (Figure S3b). This might contribute to the larger per event losses for major hurricanes. Second, the loss difference may reflect shifts in landfall location. The mean annual landfall frequency change by category for each U.S. and Mexican state (Figure S2) shows increased major hurricane landfalls in Florida, whereas category 0-2 landfalls decrease. This means that category 3-4 landfall increases affect areas with more exposure in the STORM future track set, whereas category 2 landfall decrease in the same area, but increase in regions with less coastal exposure. For TCs with category 5 LFI, there is an additional effect from the open-ended category as the LFI distribution shifts to higher intensities, with the median LFI increasing from 71.8m/s to 72.3 m/s (Figure S3c).
The resampled YELT has a higher AAL and higher OEP losses for low return periods (<5 years) compared to the spatial YELT, due to the increased frequency of category 1-2 landfalls and overstating the event loss for category 2 landfalls, as events are copied at random. On the other hand, the lower tail risk arises from the smaller per event loss in the resampled YELT for categories 4 and 5. Both limitations arise from not considering spatial information in the resampling approach used herein.
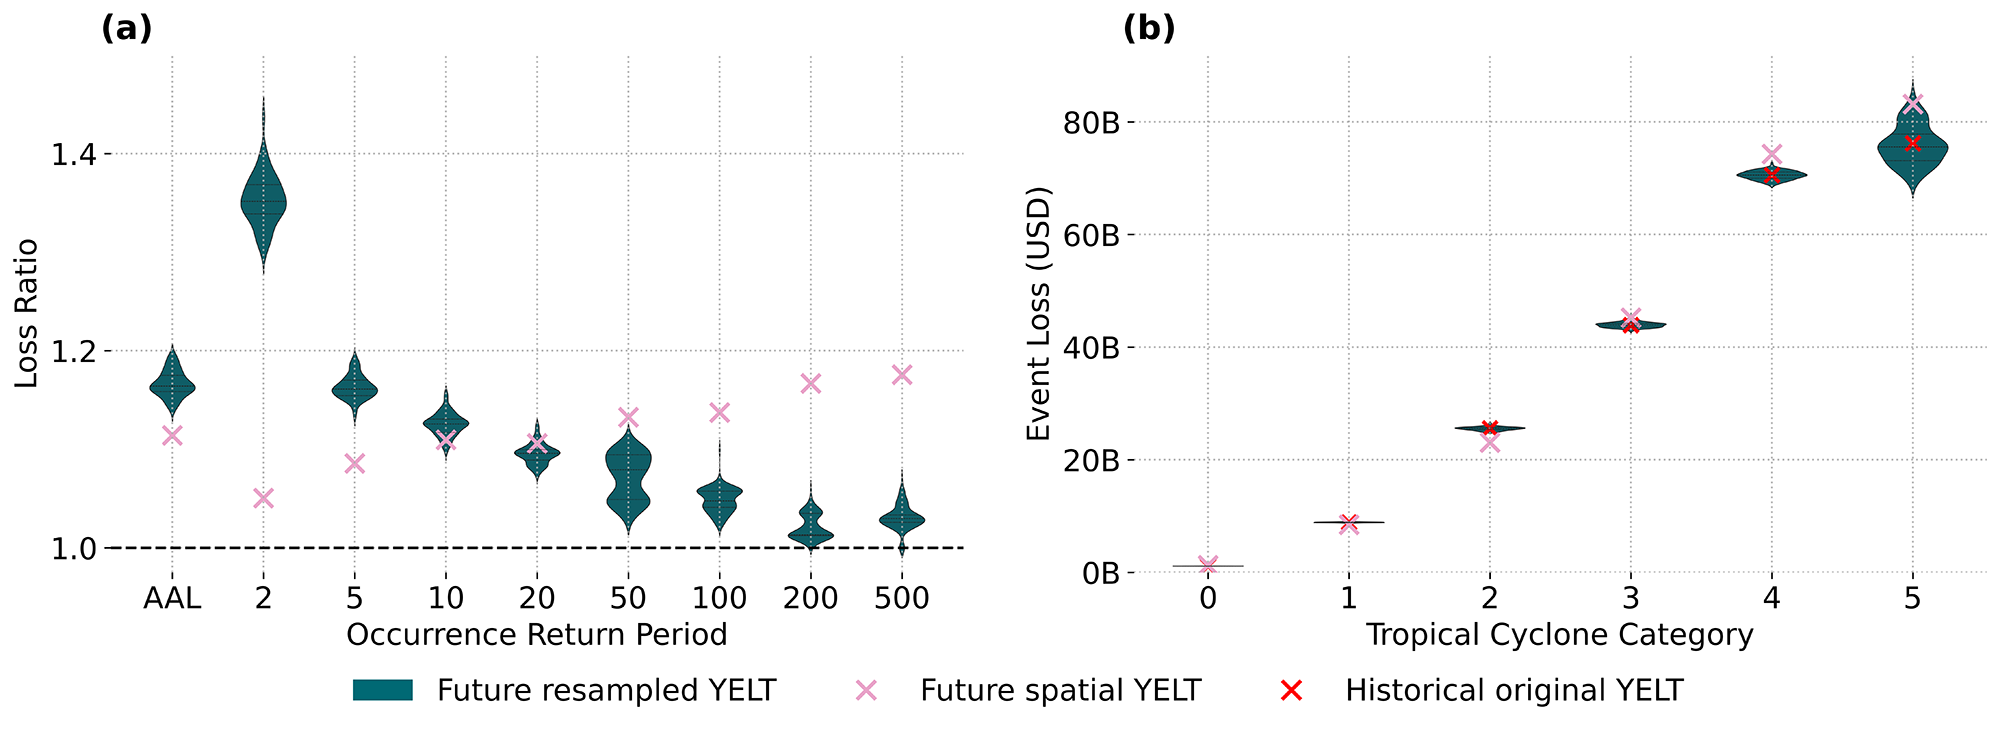
Figure 6: (a) Ratio of average annual loss (AAL) and losses at given occurrence return periods (1/occurrence exceedance probability; OEP) between future and historical YELT. The future resampled YELT is identical to the dataset labelled “STORM” in Figure 4 and is obtained by resampling using the landfall ratio between STORM present and future track sets, while the future spatial YELT is calculated from the STORM future track set using CLIMADA (see section 2.3). (b) Average event loss by TC category for the future resampled YELT, future spatial YELT, and historical YELT.
4. Discussion
We present a simplified TC model (the SCILS model) to estimate climate-connected landfall rate changes for North Atlantic hurricanes. Using the SCILS model, we quantify the landfall rate changes for near-present (+1.2°C) and future (+2°C) climates relative to the historical baseline (1980–2025), and then use the landfall rate changes to adjust a YELT with a static view of risk by resampling. Our model results in a 15% increase in AAL for North Atlantic TCs under near-present climate (+1.2°C). Looking ahead to +2°C global warming level, our model projects a 44% increase in AAL and a 15% rise in the proportion of category 4–5 landfall events. These results align with prior studies that reports an increasing proportion of high intensity TCs in the North Atlantic basin (e.g., Knutson et al., 2020), and Pope and Phibbs (2025), who estimated a 39% increase of AAL in the U.S. using a similar resampling approach. However, our loss projections are substantially higher than Meiler et al. (2025), who report a median increase of 1–5% expected annual damage globally, calculated with CLIMADA using different hazard and exposure components; and Comola et al. (2024), who estimate a 5–15% rise in U.S. losses by resampling historical losses. The discrepancy with Meiler et al. (2025) can be partly attributed to differences in regional definitions, as their analysis combines the North Atlantic and Eastern Pacific into a single basin. The comparatively higher loss increase in our study reflects both the structure of the SCILS model and the characteristics of the resampling methodology.
We identify that changes in storm frequency are a major driver of future TC risk. The intensity-only model aligns most closely with the mean estimates reported by Knutson et al. (2020), which is mostly based on studies that assume a constant frequency or a slight decrease. In contrast, the full SCILS model, which incorporates both intensity and frequency changes, shows markedly higher increases in landfall rates and loss, highlighting the influence of frequency. This is consistent with recent observations of increasing TC frequency in the North Atlantic basin (e.g., Emanuel 2021, Lopez et al., 2024). The SCILS model assumes that the relation between the physical proxies and global warming level, and between the proxies and actual hurricane activity persist at unseen warming levels. However, the drivers of recent frequency increases remain uncertain, and the scientific community is divided on future frequency change, with the majority predicting slight decrease or unchanged frequencies (Knutson et al., 2020). Divergence arises from climate model choices, differing model resolutions, assumptions about climate drivers, and variations in genesis indices (e.g., Lee et al., 2020; Fosu et al., 2024). Nevertheless, TC projections based on GCMs may underestimate North Atlantic TC activity due to their inability to reproduce recent La Niña-like Pacific SST warming trends (Sobel et al., 2023). This emphasises the need for projections that account for a wider range of tropical Pacific warming scenarios, including the possibility that recent historical trends continue (Sobel et al., 2023). In this light, our projection approach is particularly valuable, as it explicitly reflects such continuing trends and helps fill an important gap left by GCM-based projections.
Resampling is increasingly used in the (re)insurance industry for climate adjustments due to its simplicity and transparency. However, our comparison of resampled versus spatially explicit YELTs reveals several limitations. First, resampling does not create new events or adjust the severity of existing ones, effectively capping extreme losses based on the input catalogue. This leads to underestimation of tail risk, especially for the open-ended category 5, which shows for losses with return periods >50 years. Second, the implemented resampling approach assigns additional events to random years without preserving interannual variability, limiting the model’s ability to capture storm clustering or extreme seasonal activity, which are projected to increase under climate change and could potentially largely affect future TC risks (Lopez et al., 2024; Rye and Boyd 2024), and may lead to larger AEP loss changes. Moreover, the lack of spatial adjustment means that evolving storm track patterns such as poleward migration are not considered. One way to incorporate the shift in landfall locations in resampling is to divide the coast into gates and resample storms for each gate, as applied by Pope and Phibbs (2025). In its current implementation, this spatial approach does not account for changes in storm size or other properties such as forward speed. In principle, the framework could be extended to condition on additional storm characteristics, however, increasing the dimensionality of the conditioning space substantially raises data requirements to obtain stable and well-converged estimates. The limitation from the open-ended category 5 remains.
Resampling provides a fast and practical approach for adjusting YELTs, particularly when spatially explicit impact calculations under the targeted climate are unavailable. It is better suited for assessing adjustments for near-term climate conditions than for long-term projections involving substantial warming, where storm behaviour is more likely to change. In any case, resampling should be applied with caution, as it underrepresents tail risk and may overestimate losses at low return periods if spatial shifts are not accounted for.
While our model offers a transparent and climate-connected framework, it entails certain simplifying assumptions. The model focuses on thermodynamic influences (PI and SST), without generating full TC trajectories. We do not explicitly include effects from changes in dynamic factors, e.g., steering flow as the signal is less evident. For steering flow, some CMIP6 models suggest higher late century recurvature likelihood, however, the signal is small, and spread between models is large (Sainsbury et al., 2022), and historical data does not show a change in the fraction of storms making landfall (Vecchi et al., 2021). Vertical wind shear enters CGI and affects the genesis potential in the SCILS model. However, it does not modify the LFI/LMI distribution (i.e. the de-/intensification process). Shear projections diverge across GCM predictions and changes are mostly not significant for mid-century changes under moderate emission scenarios (Camargo et al., 2025), thus constant regional LFI/LMI are reasonable for medium term (i.e. 2°GWL) risk assessment; see also section 2.1.
Looking ahead, accounting for spatial shifts in storm tracks and storm properties would make resampling more robust. Using storyline approaches to reflect extreme scenarios and adjust event severities (Shepherd et al., 2018), could improve the accuracy of climate-adjusted TC risk estimates in the tail. Likewise, incorporating temporal clustering into resampling by e.g., adding events based on seasonal variability could improve aggregate loss estimates. Ultimately, advancing climate-informed risk modelling requires transparent, physically grounded models that integrate the latest scientific insights with operational needs.
5. Conclusion
We present a simplified, physically grounded model to estimate changes in North Atlantic hurricane hazard from historical (i.e., 1980–2025) to near-present (+1.2°C) and future (+2°C) climates. By adjusting a year event loss table using landfall rate changes from the SCILS model, we estimate a 15% increase in average annual loss from historical time to the present-day, and a 44% increase for +2°C global warming, assuming constant vulnerability and exposure. While acknowledging uncertainties across the modelling chain, we find that hurricane frequency change plays a critical but poorly understood role in future risk. Our results show that resampling offers a practical method to adjust static event sets to near-present climate for return periods of 10–50 years, though it may underrepresent risk in the tail. This work offers an alternative view to climate model-based approaches and a starting point for integrating climate signals into catastrophe models using accessible data and transparent methods.
Supplementary Figures
Available as a separate PDF; download here.
References
Acknowledgements
The authors JL and CBS received funding from the Swiss Innovation Agency Innosuisse under Grant Agreement No 120.464 IP-SBM.
Data availability
The observed North Atlantic TC data are obtained from IBTrACS version4r01 (Gahtan et al., 2024; website: https://www.ncei.noaa.gov/data/international-best-track-archive-for-climate-stewardship-ibtracs/v04r01/access/netcdf/).
ERA5 monthly average data on pressure levels were downloaded from C3S (2023a).
ERA5 monthly average data on single levels were downloaded from C3S (2023b).
The statistical model STORM is fully open: the model code can be obtained from Github (https://github.com/nBloemendaal) under the terms of the GnU General Public license version 3, and datasets are available from the 4tU.Researchdata data repository (Bloemendaal et al., 2022b, Bloemendaal et al., 2023), licensed as public domain (cc0).
Code availability
The code for the open-source software framework CLIMADA is openly available at the CLIMADA repository (Aznar-Siguan et al., 2025): https://zenodo.org/records/15020318. The code for the SCILS model is openly available on Zenodo at https://doi.org/10.5281/zenodo.20506211.
Declarations
Handling Editor: Thomas Loridan, Co-Founder and Chief Science Officer, Reask
The Journal of Catastrophe Risk and Resilience would like to thank Thomas Loridan for his role as Handling Editor throughout the peer-review process for this article. We would also like to extend our thanks to the chosen academic reviewers for sharing their expertise and time while undertaking the peer review of this article.
Received: 11th September 2025
Accepted: 1st April 2026
Published: 2nd June 2026
Rights and Permissions
Access: This article is Diamond Open Access.
Licencing: Attribution 4.0 International (CC BY 4.0)
DOI: 10.63024/zd46-e3zf
Article Number: 04.03
ISSN: 3049-7604
Copyright: Copyright remains with the author, and not with the Journal of Catastrophe Risk and Resilience.
Article Citation Details
Liu, J., et al., 2026. Recalibrating Risk: a Simplified Model for North Atlantic Hurricanes in a Warming Climate, Journal of Catastrophe Risk and Resilience, (2026). https://doi.org/10.63024/zd46-e3zf
Share this article: https://journalofcrr.com/research/04-03-Liu-et-al/